

Background
In this article, I am going to talk about the things that you can do with Dynatrace while deploying your applications to monitor them. This will give a brief overview of what Dynatrace can do to your infrastructure and help you in monitoring every layer of the stack you have.
As we all know due to the advent of enterprise cloud back in the 2010s, applications started to getting bigger, efficient, and better. Technically according to Moore’s law, it is doubling every 18 months including the hardware capabilities and the way we write code and use CPU to execute the programs.
As this need increased, demand for advanced monitoring solutions is also increased. second-generation monitoring tools were too manual and it required doing a lot of setups and it impacted MTTR for the Ops team whenever a problem came.
Hence, we at Dynatrace developed a third-generation tool. It was not like we were introduced to the market as fresh comers, we had the experience of AppMon (predecessor of Dynatrace). It was quite a powerful tool but it was not enough to adapt to the enterprise cloud where millions of transactions happen every minute.
It needed more AI approach which should handle problems once they come in with a less human intervention. This was the moment when Dynatrace was born and started rolling out in 2014. To keep it short, we just wanted to give intelligence for your monitoring team where it acts as an assistant by lifting heavy loads. Specifically, our tool is built for those who want to deliver the best software for their end-users.
Technical Terms Used
- Environment: Dynatrace portal where you can install OneAgent and monitor all the resources. This term is mainly used in Managed installations.
- Tenant: This is similar to the environment but this term is mainly used in the SaaS deployment model.
- Cluster: Set of servers where Dynatrace is deployed in. Usually in general scenarios, we recommend a 3 node cluster for high availability.
Getting started with Dynatrace deployment
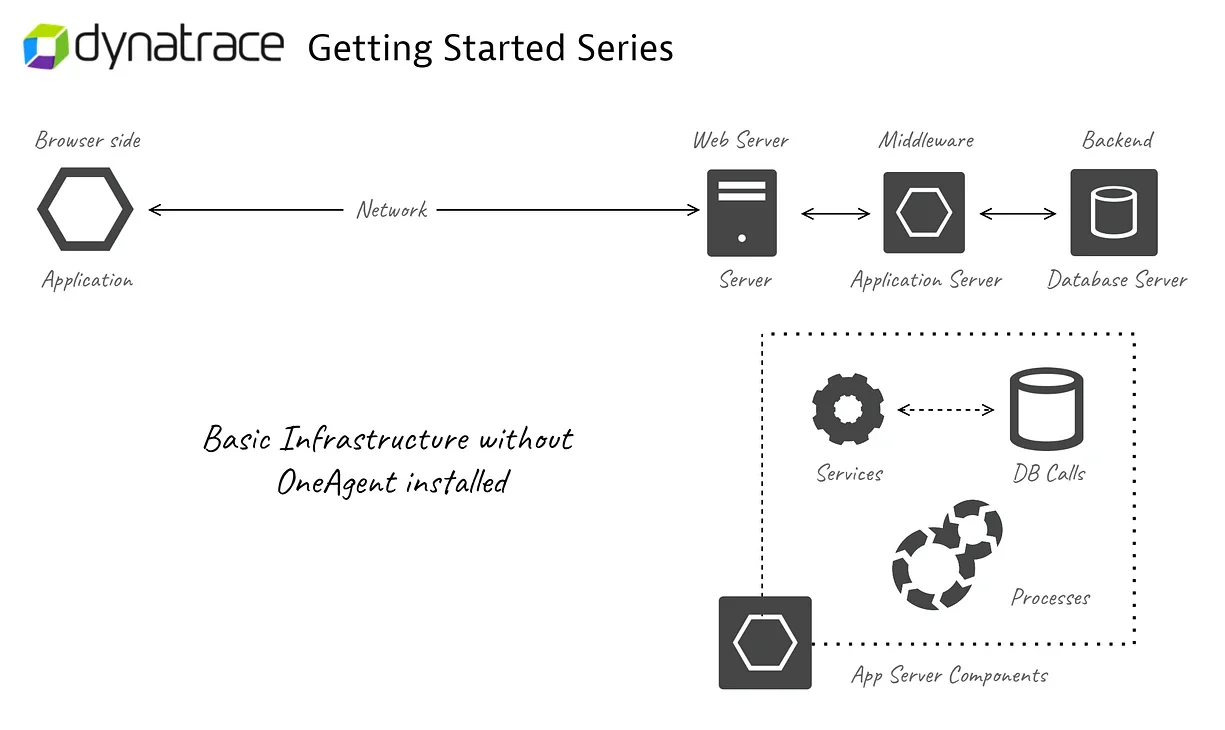
Deployment of Dynatrace is made very simple by our team. It is like all-in-one software that detects your application processes, services, infrastructure, databases, and real users who use your application across multiple platforms and devices. We call this software as OneAgent — It is responsible for collecting all monitoring data within the monitored environment.
Furthermore, we will discuss how to deploy OneAgent and what exactly it does and how can you make your Dynatrace environment better for monitoring.
Dynatrace has its own USP (Unique selling point) with its uncompromising technology advancements such as OneAgent, Smartscape, and PurePath apart from deterministic AI (Dynatrace Davis).
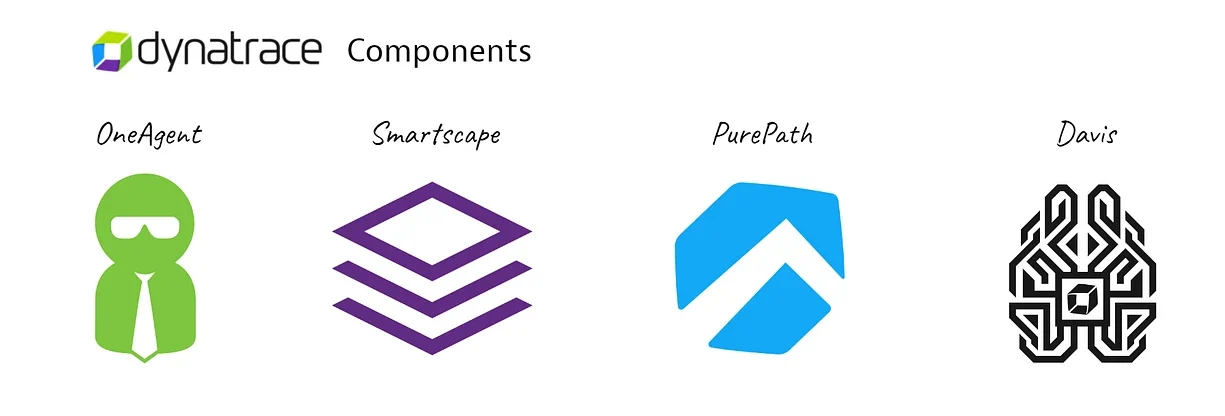
OneAgent
It is a full-stack observability software that automatically detects, collects, maps all the monitoring data of your application hosts, processes, services, and databases then encrypts the data and sends it to the Dynatrace cluster or ActiveGate.
Once we install OneAgent on our servers it will start its work by sending all monitoring data to the Dynatrace cluster in real-time with strong encryption algorithms in the place where the data can only be decrypted by Dynatrace cluster belongs to the customer.
So to understand briefly how OneAgent collects the monitoring data, let’s consider a scenario where you have an application that is deployed on the server, and this application is service 1000 customers at a time. Now, if you install OneAgent in that host/machine, OneAgent will start its work by first detecting the most important processes that are running on the host. There is an exception for Windows processes. OneAgent will detect these important processes and starts to monitor them but still, these processes are not deeply monitored.
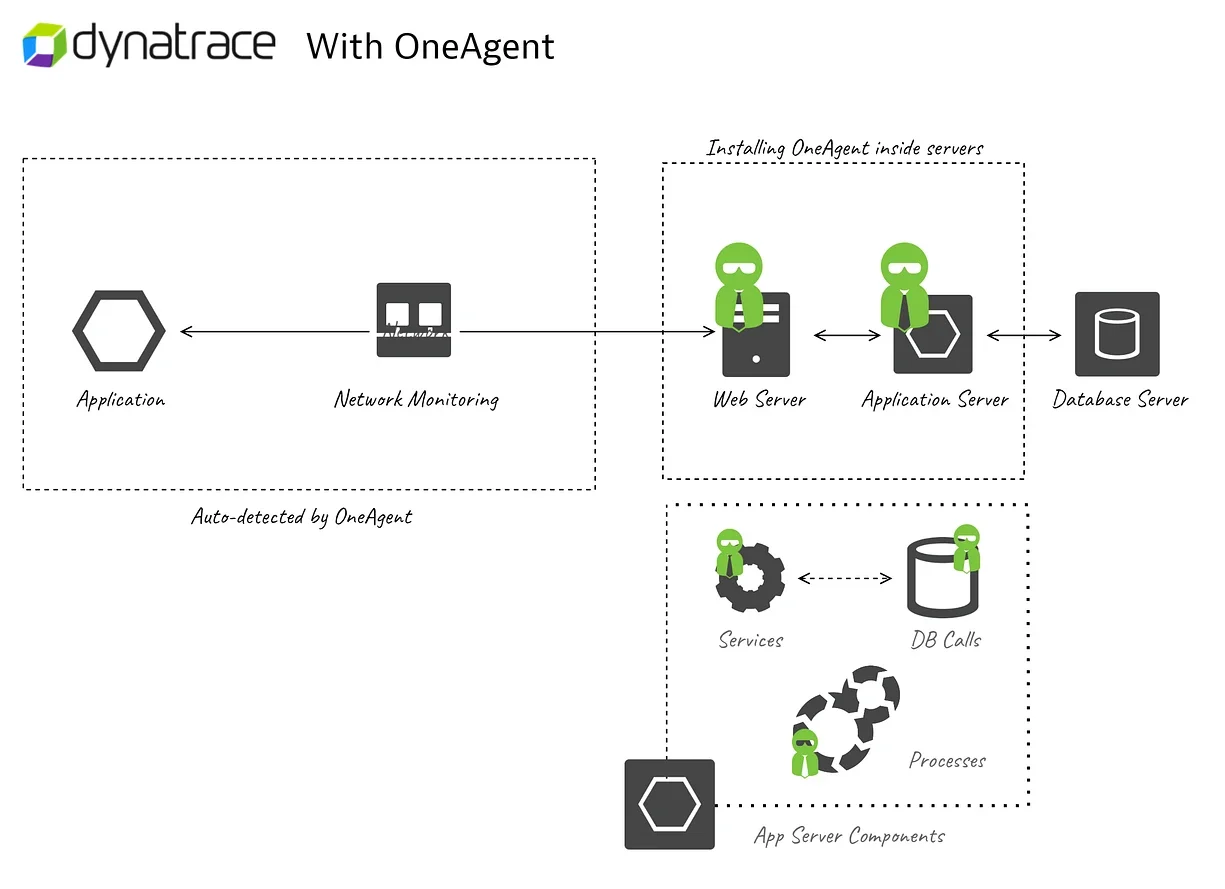
You can check the status of monitoring on the Deployment status page in our portal. To enable deep monitoring like getting code-level insights, you might have to restart those application processes one by one. When these processes are starting up, OneAgent will inject itself in the code and does the byte code instrumentation — This is where OneAgent will get the capability to monitor code-level insights and also capturing services that are living inside these processes. I am not going in-depth about how OneAgent instruments each application module.
Tips on OneAgent instrumentation:
When we restart our application processes, OneAgent will instrument each of them and starts monitoring in real-time. Data sent to the Dynatarce cluster is encrypted and the communication will also happen via strong SSL. It is recommended that to restart the process for successfully instrumenting the processes. It is not the best way for you to try and restart the complete machine/host after installing OneAgent.This is because, if there is a lightweight process that needs to be instrumented or if OneAgent starts after the application process is started after the restart of the machine, OneAgent will not be able to instrument that process. Hence, it is a best practice to keep the OneAgent service running on one end and restarting other processes/services at the other end to makes instrumentation smoother.
OneAgent will detect DB queries from Application server side itself. Database is detected as a service and direct DB monitoring is not done. However, you can install OneAgent on DB host to get infrastructure monitoring. This will help you in monitoring DB process and its availability.
Host Groups
When we are installing OneAgent on any host, we will set an important parameter that is the host group. Host groups are the sets of hosts that perform similar functions or belongs to the same application/team, for example, a host group can consist of all the servers that an application runs on. If it is a multi-tier application or even it is a single-tier application. Host groups can have one or more hosts in them.
Naming Host groups or creating them is completely left to the user monitoring needs but in Dynatrace, if we create host groups we have some unique perks like setting anomaly detection, declarative process group naming, OneAgent updates, and much more especially for the set of hosts that belong to the particular host groups.
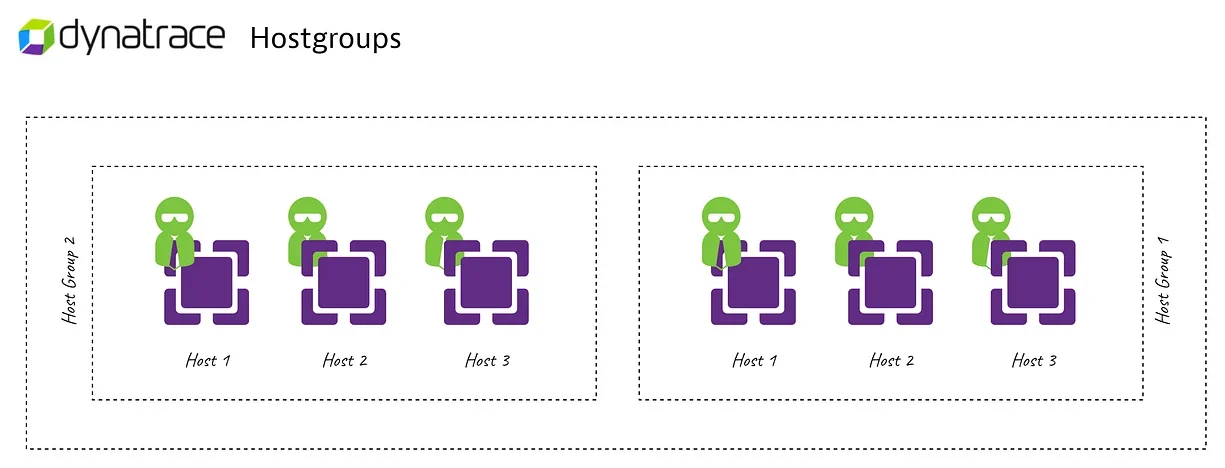
These host groups can be assigned in Dynatrace at 2 times, One while installing OneAgent. Second, using the oneagentctl command after installation — This command is found in the agent/tools directory where OneAgent is installed.
$oneagentctl --set-host-group=myHostGroup
To use the oneagentctl tool, you need to perform the OneAgent service stop and start operation before changing the parameter and after respectively.
You can use the below parameter to set the host group while installing OneAgent using the command line (in both Windows and Linux).
--set-host-group=myHostGroup
Smartscape
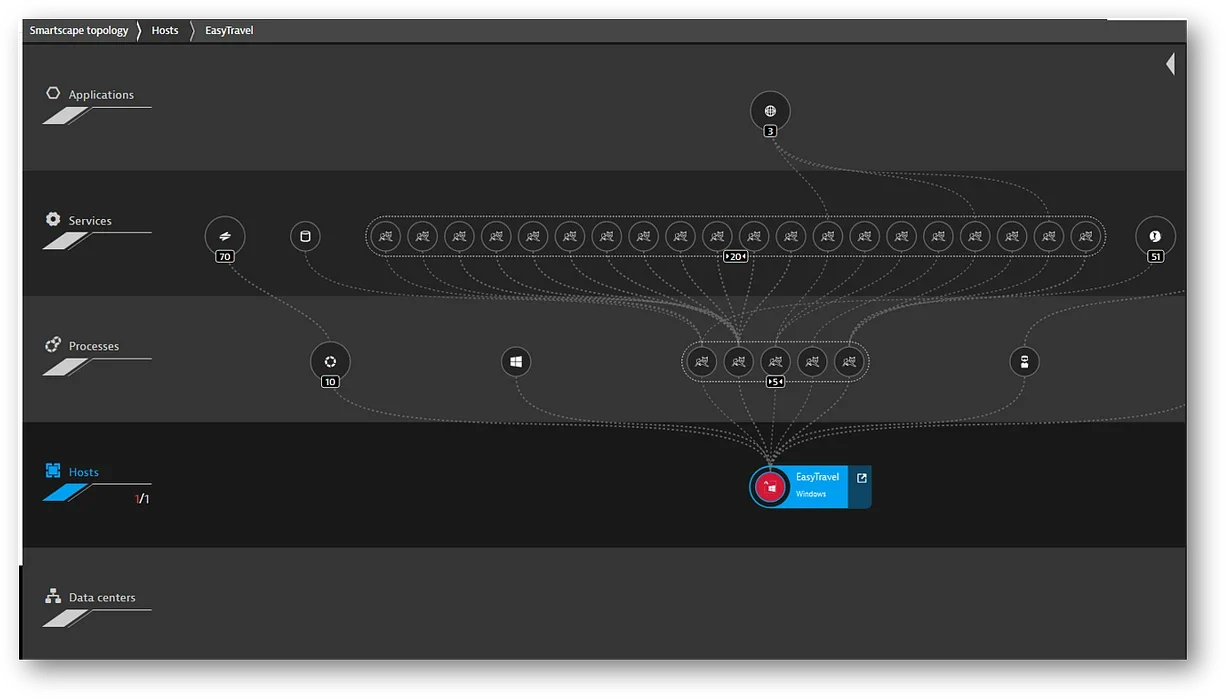
Once OneAgent is installed and processes are instrumented, it starts to send the monitoring data to the Dynatrace cluster or cloud. This also involves dependency mapping of all the entities — This means, mapping of server, processes, services that are depending on each other. It is visually represented in Dynatrace WebUI as the Smartscape topology.
PurePath
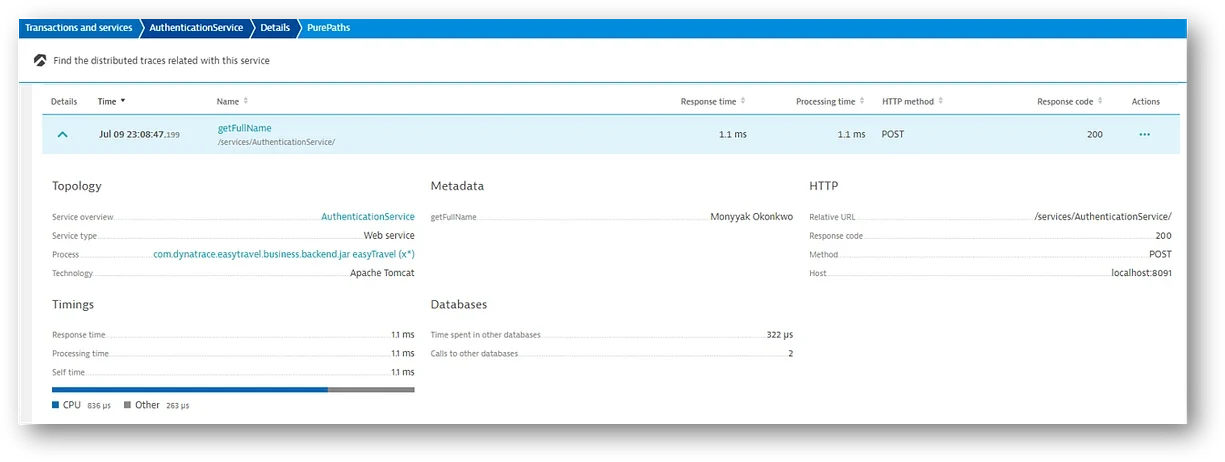
PurePath is the sole technology developed by Dynatrace even when there was an existence of our 2nd generation tool AppMon. It is automatically included when we install OneAgent on the server. As soon as OneAgent starts the monitoring of services, it will start to capture each request that comes to the server from the client or any interprocess communication. Every request that is captured by OneAgent is called PurePaths. This contains even database calls that are made for these requests along with the metadata which contains the status code of the response, service method, service class, and other code-level details.
PurePaths will also contain sensitive code-level information as well. Hence, it is very much necessary to have the right security in place. Most of the things are already covered by Dynatrace thanks to its strong encryption algorithms. To know more about security, you can refer our official documentation here.
Understanding ActiveGate and Network Zones
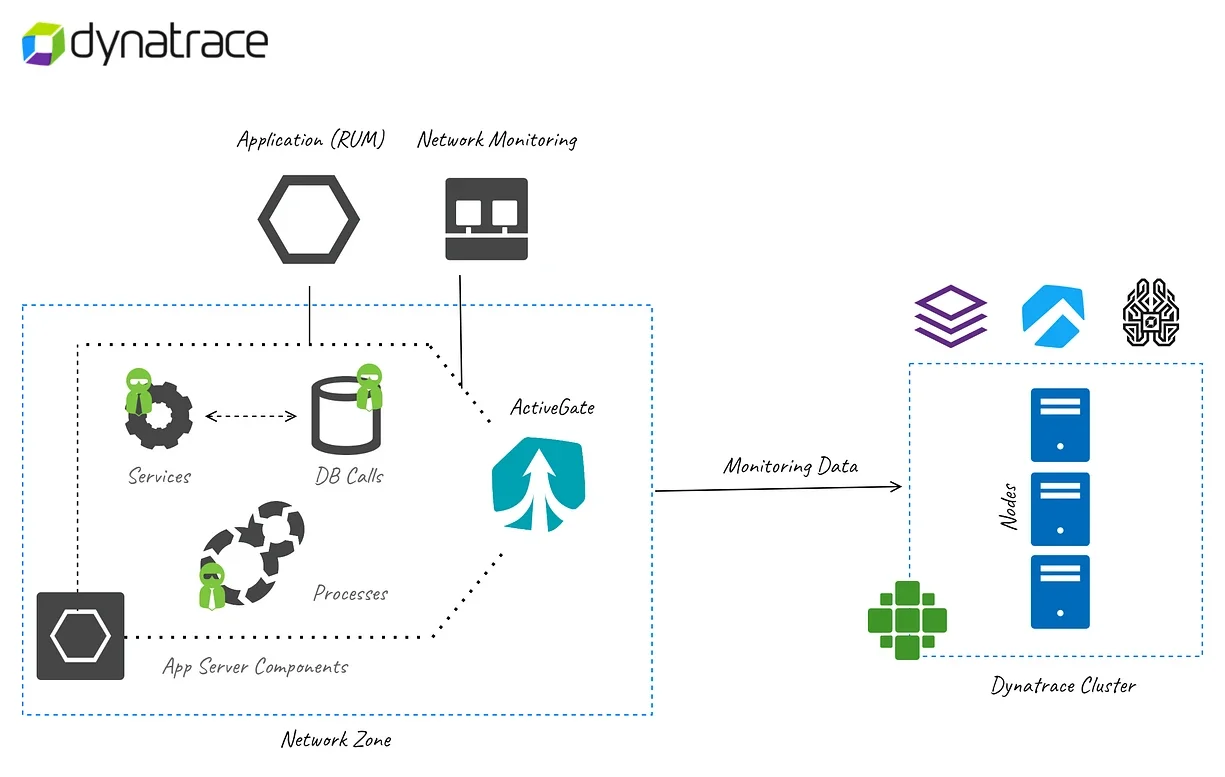
ActiveGate and Network Zones concept extends the understanding of communication from OneAgent to Dynatrace server to one more level. Simply you can say, ActiveGate acts as a proxy between OneAgent and Dynatrace server. However, network zones will help these communication happen in the given boundary without creating unintended communications — When there are multiple ActiveGates in place, using network zones we can direct communication of OneAgent to happen to particular ActiveGate(s).
ActiveGate
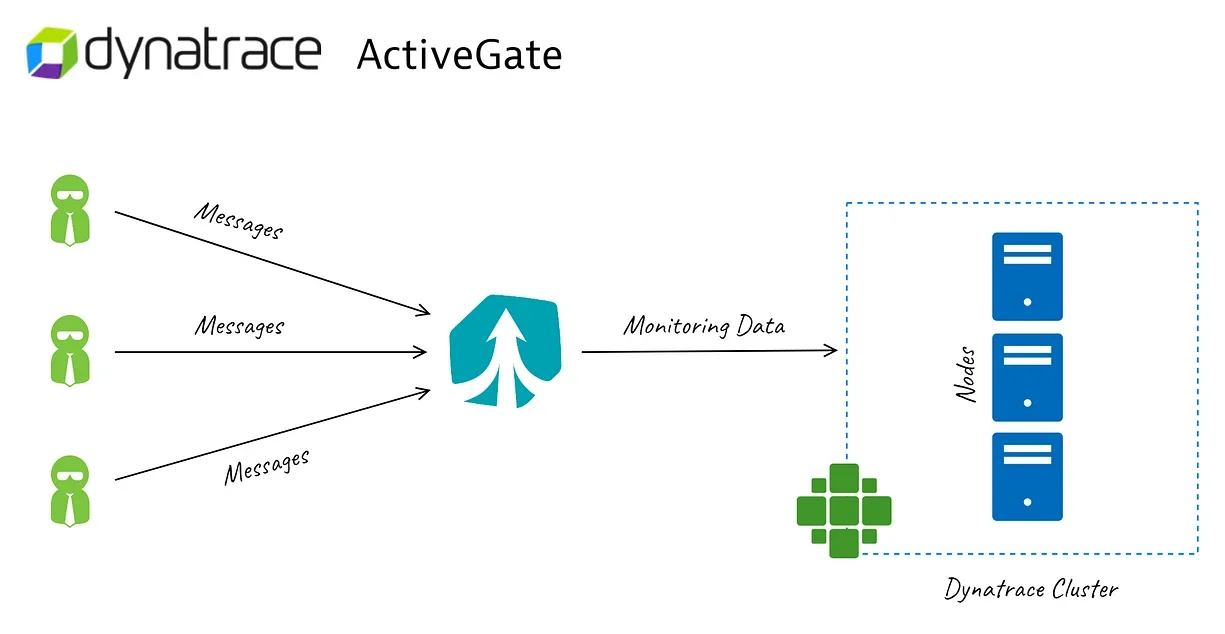
It is recommended to have ActiveGate installed for better communication between OneAgent and to Dynatrace server. It is measured that there is almost 70% of throughput and 30% network bandwidth will be reduced if we use it in our deployments.
Having ActiveGates in our architecture will help in many ways. Especially when you have large deployment scenarios. If you have more than 100 agents installed in your servers and the communication is happening without ActiveGate, this often consumes the network bandwidth and increases the throughput for the Dynatrace cluster.
Since the communication happens in real-time, the number of connections will be very much higher. If you have an ActiveGate in place, this will help you in bundling, compressing data, routing data it received from OneAgent. Then it will send that data to the Dynatrace server. This compression and bundling of data will help in achieving less overhead.
Installation of ActiveGate
Installing ActiveGate is fairly simple and direct as it supports both Windows and Linux. You can see the list of supported OS here. We can install ActiveGate from the Dynatrace portal.
Tip: You can install ActiveGate along with OneAgent in the same machine. In production scenarios, make sure you have the right hardware to run it.
From the portal, you can go to Dynatrace Hub > ActiveGate > Install ActiveGate > Select the OS > Download the installer
ActiveGate is dedicated to a per-environment basis. It only communicates with the environment that it is downloaded from. Even OneAgent is the same. Before installing ActiveGate let’s understand the concept of network zones. To exactly understand the purpose of network zones, you should know that there is a small drawback in ActiveGate implementation.
Note: Working of network zones and ActiveGate are totally different. Network zone concept is introduced to help the communication of OneAgent and ActiveGate in a specified space of their own.
The drawback of OneAgent & ActiveGate communication
When you have deployed more than one ActiveGate, by default OneAgent doesn’t know to which ActiveGate it should send data. In such scenarios, communication happens in a round-robin fashion. Also, it is the duty of OneAgent to check for the availability of ActiveGate and if it is down, it should start checking other ActiveGates that are available for communication. This check happens every 5 mins. Even if ActiveGate is in a separate Datacenter, it will start communicating with that and this is not controlled.
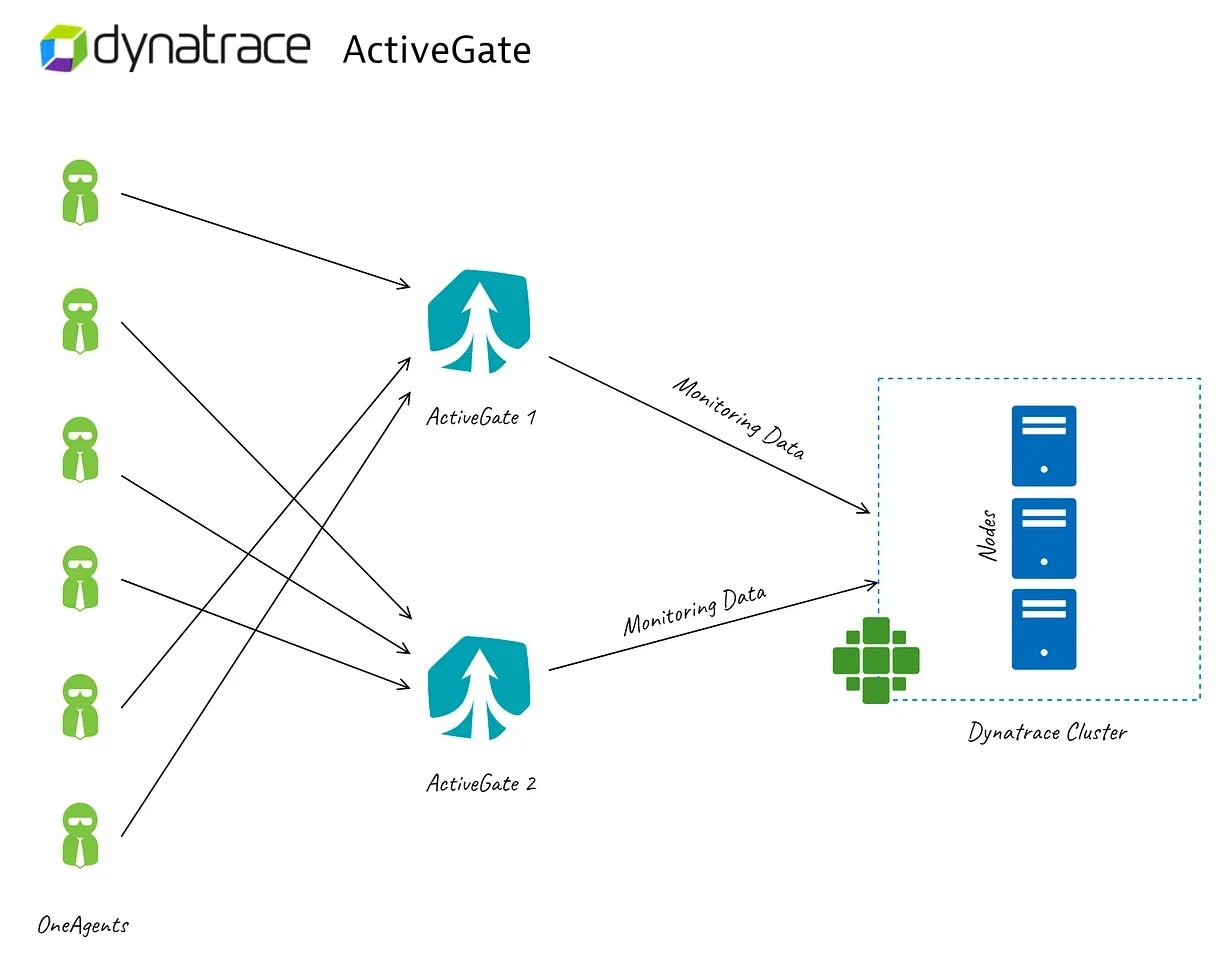
For instance, if you want OneAgents in datacenter 1 to communicate with an ActiveGate which is in datacenter 1 itself, you need to set firewall rules to control the traffic that is sent. In order to prevent this hassle in your team, we have introduced network zones.
Network Zones are still in early adapter phase at the time of this article is being written.
If you have large deployments like over 100 servers, it is necessary to have ActiveGate. It helps you to monitor your cloud environments as well. Without ActiveGate, you cannot monitor your cloud environments like Azure or GCP.
For AWS monitoring, it is not mandatory. To know about ActiveGates and its purposes, you can visit here.
Network Zones
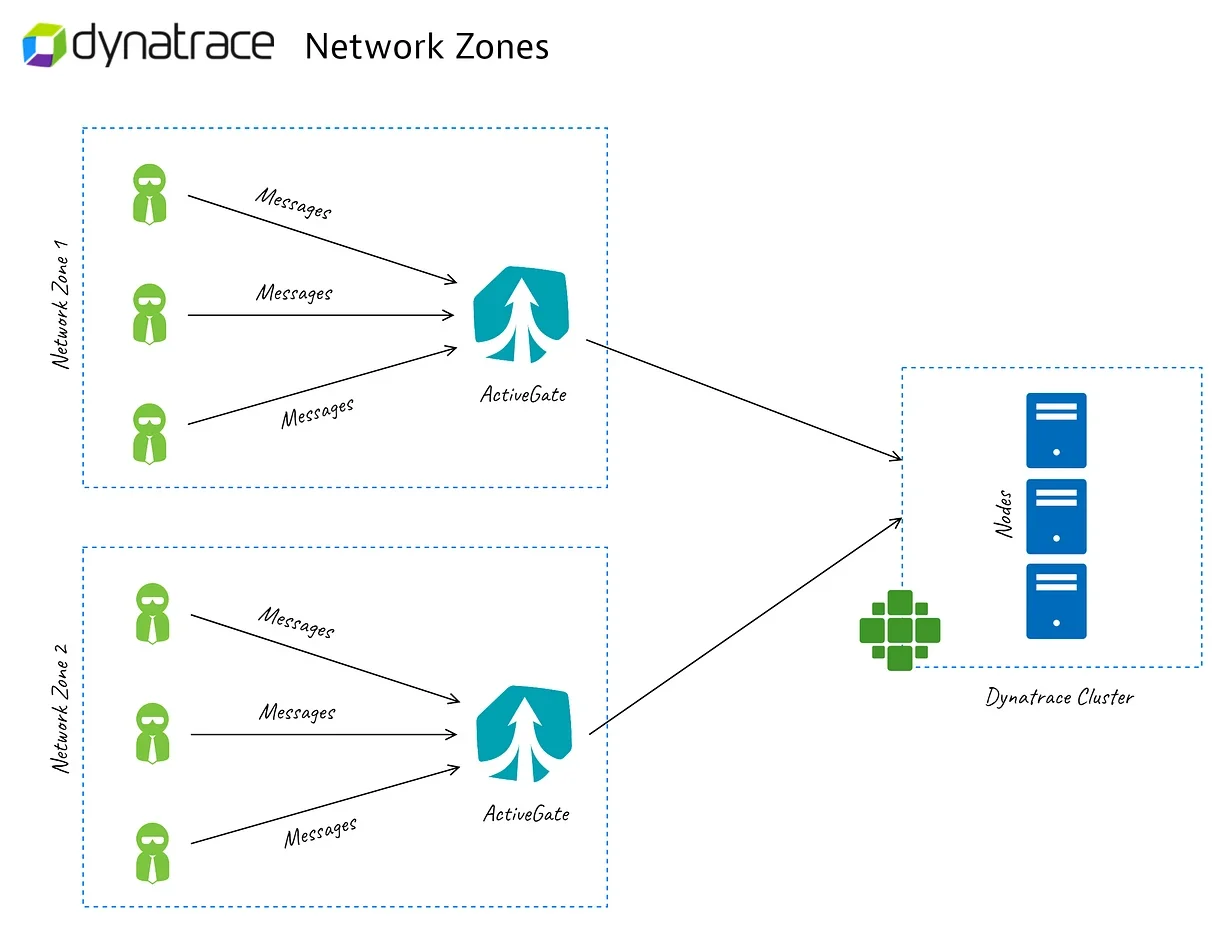
Don’t worry this is the last concept that we talk about in this article. This is a newly added feature to help OneAgent to communicate easily with ActiveGate without any confusion — 99.9% of times software will not get confused unlike humans but still, when they get confused, we receive outage alerts.
By creating Network Zones, you can easily tell OneAgent to communicate with ActiveGates that are inside the same zone as OneAgent. This will make our life easier and no need to setting up any firewall rules or chasing the network team to route the communication. Simply you can define a network zone and tell OneAgent to communicate in it, and this will start to communicate inside that network zone. As a failover mechanism, you can also define alternate zones for communication.
Creating Network Zone
You can create a network zone in two ways,
- At the time of installation
- After installation
You need to define the network zone in both ActiveGate and in OneAgent as well. While installing ActiveGate or OneAgent, you can use the parameter while installing using the command line.
--set-network-zone=<network-zone-name>
If you want to add network zones to the existing installation, you can even do that. For OneAgent it is using oneagentctl command and for ActiveGate it is by adding connectivity step in its custom.properties file.
It takes couple of minutes to reflect network zones in OneAgent. You may need to wait for a minute or to to see the communication that is reflecting in the portal.
While changing network zones, please don’t forget to stop the service and then start the service of OneAgent or ActiveGate. To know more, visit Dynatrace documentation
Summary
To finish our first step in learning Dynatrace, here is the summary so that you can refer to it.
- Background of Dynatrace
- What is OneAgent and why it is so special?
- Important components of Dynatrace.
- Why do we need ActiveGates?
- On top of that, why network zones?
- What is so special about network zones and how it is configured?
Happy Reading and stay tuned for more articles related to Dynatrace. In the next one, we will discuss more details on Smartscape and Applications.