
About two days after I launched my website, I opened the billing dashboard. I had five or six daily active users. I also had roughly ₹1,000 in cloud charges.
I’d spent eleven years building websites, monitoring enterprise applications, and working with customers whose systems handle billions of transactions a year. Yet on my own site, I’d paid more attention to what a reader would see than to what the platform would do every time I changed something.
I’d wanted a site of my own for fourteen or fifteen years. I kept the domain through two or three attempts. Gates Notes helped me see what I wanted this time. I liked how Bill Gates made room for what he was reading, learning, and thinking about. I wanted somewhere to bring together a decade of writing and share what I was still figuring out.
I built The Harithsa Notes on Firebase, imported the articles, added illustrations, and put it online. As I adjusted the design, I made roughly fifty or sixty releases in those first couple of days.
The site had more releases than readers. Once I noticed that, I had a better question for the bill. What was I paying the platform to do, and how often was I asking it to do it?
What a reader saw and what the platform did
Firebase Hosting kept releases and delivered files. Cloud Run handled requests that needed application code. Cloud Build prepared deployments, and Artifact Registry stored the container images. A reader opening a page could trigger a download. A change to a sentence could trigger a build. An old release could sit in storage all day without a single visit.
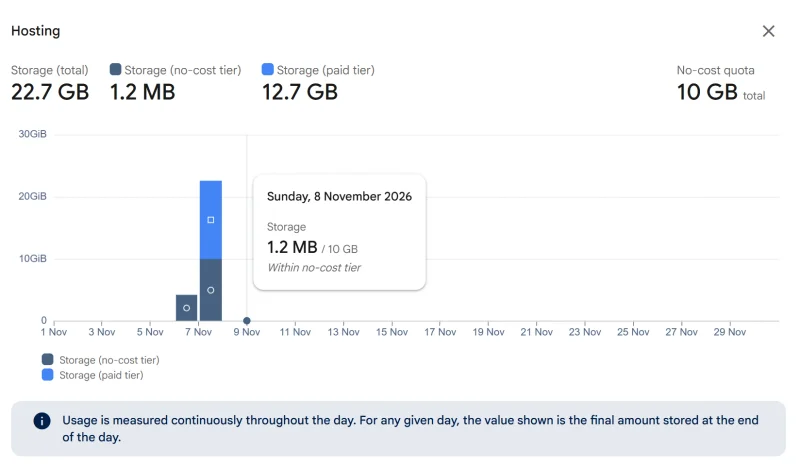
Some of my earlier deployments took fifteen to twenty minutes. Public artwork travelled with the site, old releases accumulated, and I found a brand ZIP in the upload folder. The Hosting storage dashboard reached 22.7 GB. The roughly ₹1,000 was the total that caught my attention. I’d need the billing breakdown to assign any share of it to a particular service or activity. Firebase Hosting usage and pricing
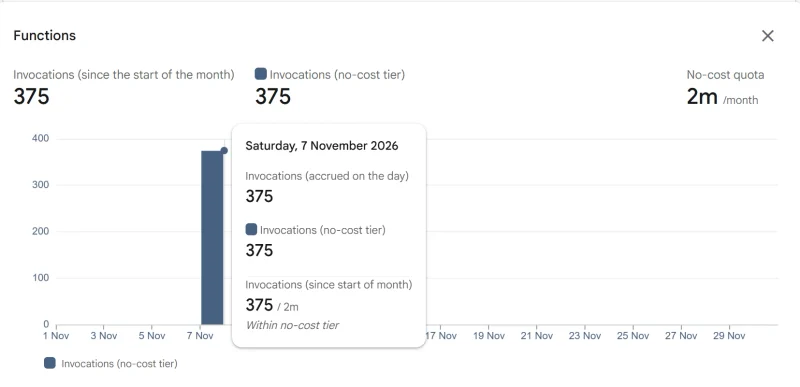
The Functions panel, for example, showed 375 invocations within the no-cost tier on November 7. That was useful evidence about one meter. The Hosting panel was measuring something else entirely.
I separated things that change at different speeds
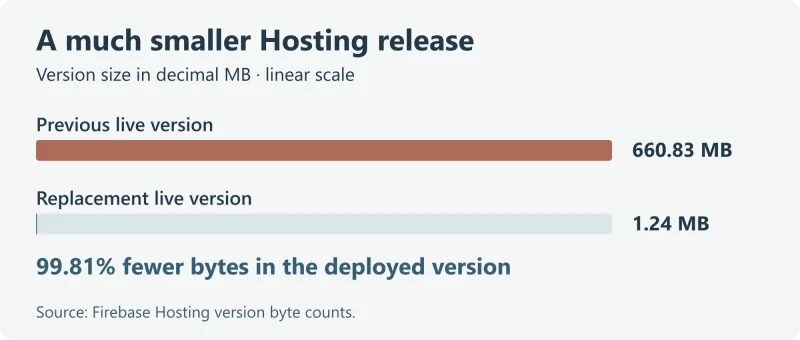
An illustration can stay on an article for years. I might change a sentence three times in one afternoon. I moved public artwork to Firebase Storage, excluded archives from deployments, and limited retained Hosting releases. One live Hosting release was 660.83 MB. Its replacement was 1.24 MB. Separately, the project’s Hosting storage dashboard later showed about 1.2 MB on November 8. The dashboard measures storage across the project. The release comparison measures two individual versions.
I checked what a browser would download separately. One illustration was 279.4 KB at full size. The 800-pixel version was 48.0 KB. The browser could choose a rendition that fit the layout, and a reader could still open the larger image. A million requests that made that exact substitution would transfer about 231 GB less image data, before accounting for caches and the mix of images and devices.
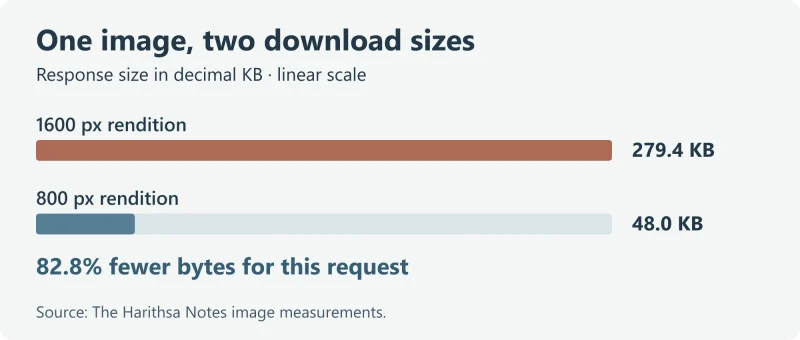
The deployment change also let me publish a Hosting-only update using the backend revision I’d already built. If a build spends time resizing unchanged images, compressing them, or uploading them, skipping that work can shorten a job billed by build time. I’d time equivalent builds before estimating what that saved. I’d also compare Hosting and Storage together, since some of the download work moved between services. Cloud Build pricing · Cloud Storage pricing
The November 7 tooltips show why I’d look at both dashboards. At capture, Hosting showed 131.7 MB of downloads for that day and the selected Cloud Storage view showed 54.4 MB of bandwidth. Those readings give me places to investigate. For a savings estimate I’d compare equivalent usage windows, account for traffic and cache hits, and check the actual charges.
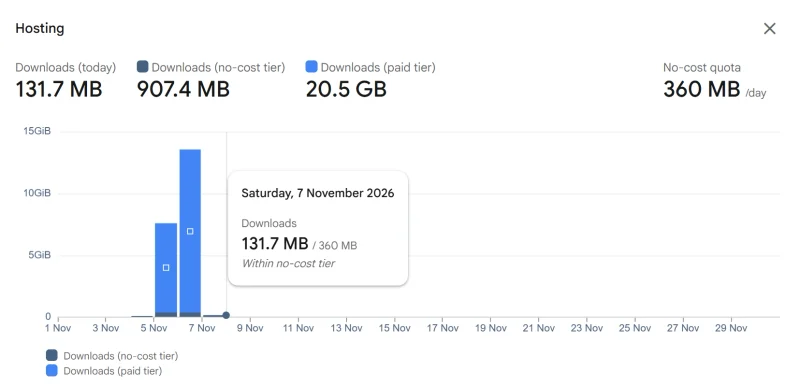
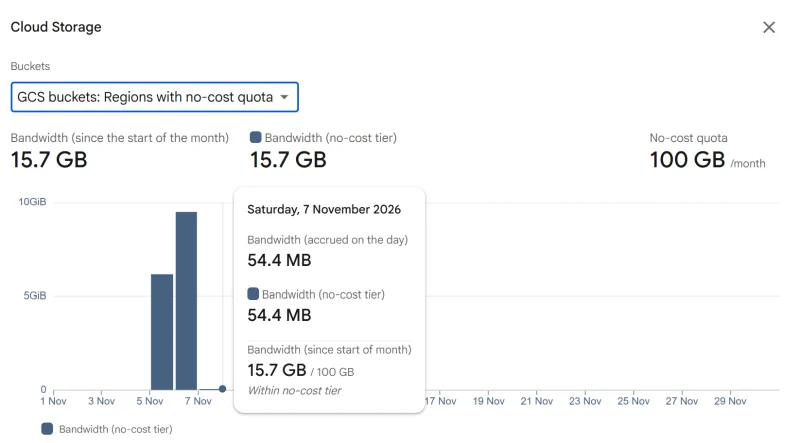
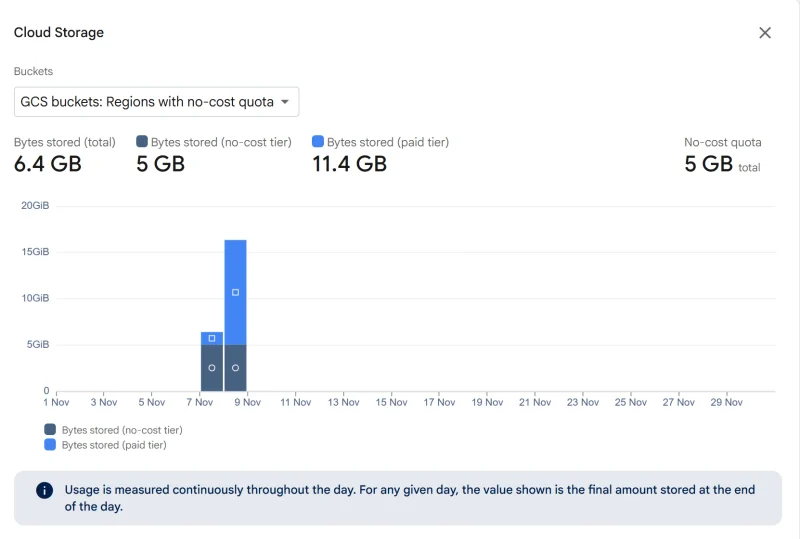
Cleanup had a cost of its own. I found about 17.25 GB of soft-deleted objects in the media bucket at the time of the review. Cloud Storage still meters recoverable objects during that retention period. I can see why I’d want recovery for an accidentally deleted photo. A build archive I can recreate deserves its own retention decision. So does a release I’d actually know how to restore. Cloud Storage soft delete
AI makes it easier to skip a lesson
One of the things I love about building with AI is how quickly I can see whether an idea feels right. It also makes it easy to say “build and deploy this” without asking what services will be created, what gets repeated, and which decisions I’ll have to live with after the deployment finishes. If I can’t explain why a change affects the bill, I have a piece of the system left to learn.
In a randomized experiment with 52 software engineers learning an unfamiliar Python library, researchers found that the AI-assisted group scored lower on a subsequent mastery quiz. The average speed difference was statistically inconclusive. Participants who used the assistant to ask questions and understand the concepts tended to do better than those who delegated the work wholesale. The experiment measured learning a programming library. I see a parallel for cloud architecture. If an agent picks the services and I never walk through the decision, I miss the chance to learn what changes their cost. Shen and Tamkin, How AI Impacts Skill Formation
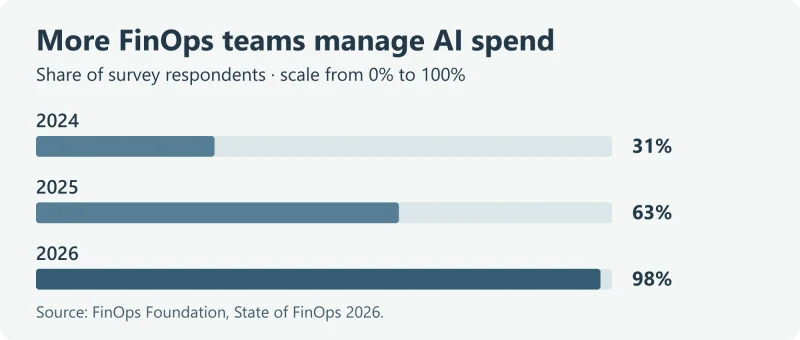
At the same time, AI is becoming a cost that FinOps teams have to manage in the applications themselves. The FinOps Foundation’s survey series reports that the share of respondents managing AI spend rose from 31% in 2024 to 63% in 2025 and 98% in 2026. Flexera’s 2026 survey also puts estimated waste on cloud infrastructure and platform services at 29%, based on respondents’ estimates. These surveys capture different groups and different questions. They give me a reason to look closely at the work my systems are doing. State of FinOps 2026 · Flexera 2026 State of the Cloud
What I mean by DevFinOps
I think of this as DevFinOps. Keep the DevOps habit of sharing responsibility for how a service runs, and bring finance and product into the decisions that determine how much it costs to run. The FinOps Foundation already describes collaboration across engineering, finance, and business as part of the practice. I use DevFinOps to name the conversation I want while a feature is still being designed. FinOps Foundation, What is FinOps?
Engineering can explain what the system does. Finance can help allocate the bill and model demand. Product can say what the customer actually came to do and what quality is worth paying for. I want all three looking at the cost of delivering one useful outcome.
Start with one journey in an existing app
Take an e-commerce checkout built up over twenty years. A new front end might call a recently added fraud service and an inventory system older than most of the team. If a customer retries a slow payment, does the backend recognize the first request? Does it run the fraud check again? One successful order could come with several attempts, and those attempts can show up in compute, database calls, or vendor charges. An AI feature has a similar shape. A user sees one answer while the app may make multiple model calls.
Start with allocated cloud cost ÷ active users over the same period. Define “active” with product, agree which costs are in scope with finance, and keep shared or unallocated costs visible. For a specific feature, pick a denominator closer to the work, such as completed orders or resolved requests. Break the result down by tier or workload if a single average hides heavy users or expensive journeys. An average cost per active user includes a share of fixed costs. Estimate the cost of serving the next user separately when planning growth. FinOps Foundation, Unit Economics
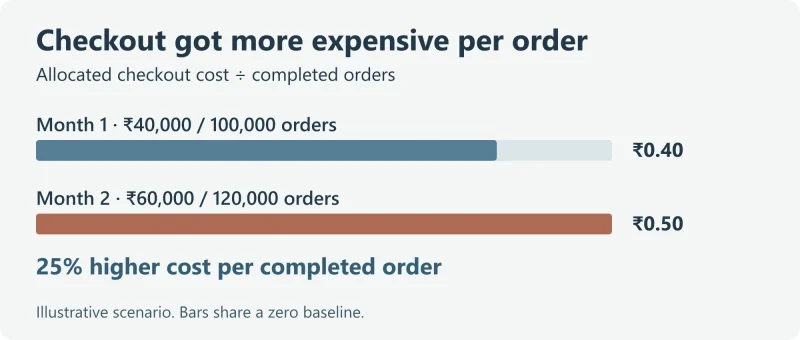
Suppose checkout costs ₹40,000 and completes 100,000 orders in one month. That’s ₹0.40 per completed order. The next month it costs ₹60,000 and completes 120,000 orders. Now it costs ₹0.50 per completed order, a 25% increase. I’d follow one successful order and one retry through the system, check how often each happens, and compare the costs with what changed in the product. A more expensive fraud check might prevent enough losses to justify it. A duplicate call after a timeout might be work we can remove.
For an app already in production, I’d baseline the unit cost, pick one expensive or repetitive step, and test a change. Keep an eye on the customer outcome alongside the bill. If the cost drops because fewer people finish checkout, the team has learned something different from what it set out to learn.
Run the rehearsal before a new app ships
- Follow a customer action. Try it once, then on a slow connection or after a timeout. Look at what the customer experienced and what the system did again.
- Ship a small change. Fix a sentence or adjust a button. See what gets rebuilt, uploaded, and retained. That’s how I’d have caught the artwork travelling with my releases.
- Put a forecast next to the prototype. Model expected and higher demand. Separate work that grows with traffic, work that grows with deployments, and storage that grows until someone clears it. Agree on an operating budget and the changes that need a cost review.
- Ask the agent to explain the design. Have it identify the billable services, what changes the cost, and where you can see the usage. Ask a person on the team to walk through the answer. Set an owner for the first cost review after launch.
I built The Harithsa Notes because I wanted somewhere to share what I’d learned. The site gave me an example in its first week. If I started it again, I’d open an article on my phone, change a sentence, and publish the edit. Then I’d look at what the phone downloaded, what the build repeated, and what the platform kept. I’d do it while the answers could still change how I built the site.