

The last time I wrote about my website, I had five readers and a cloud bill close to ₹1,000. I moved the artwork out of the deployment package, trimmed what I kept in Hosting, and let the browser choose smaller images when it could. Then I went back to see what changed.
The active-user count I was watching went from 5 to 25. Twenty-five is still a small room. I was happy to see more people in it. I was just as curious about how much work the website was doing behind the scenes.
My dear cousin read Part 1 and told me there was too much text. I’d written about what I saw in the Firebase console, but I’d made readers do a lot of the work of picturing it. His feedback pushed me to get better at telling the story visually. This time I wanted to show you the actual screens, walk through a real example, and let Xiaohei have a little fun with the parts I’d usually explain in another paragraph.
Part 1: Know Your Cloud Cost per User Before You Build
A quick map of the site
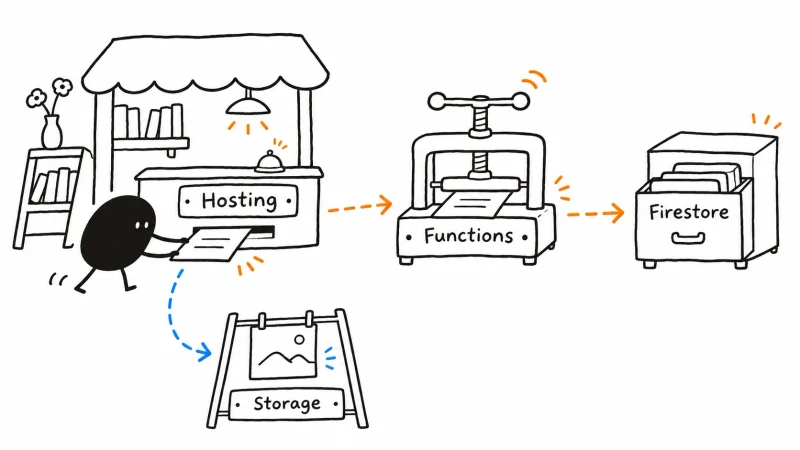
- Hosting is the front door. It serves the site’s static files and routes requests that need application code.
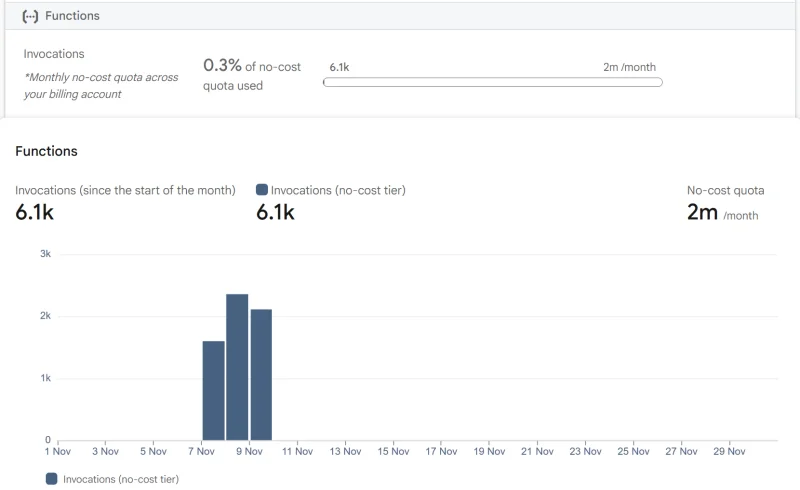
- Functions runs the server code for those requests. At launch I ran that code on a Cloud Run service I deployed directly.
- Firestore stores the site’s content and app records. It meters reads and writes separately.
- Cloud Storage for Firebase holds the media. I moved the public illustrations there so they could be served separately from the Hosting release.
What I changed · What the bill showed · Storage and downloads · Reads, writes, and Functions · Before and after · Cost per active user
What I changed
- I separated the artwork from the release. Public images now live in Cloud Storage for Firebase, with smaller renditions for smaller screens. For the bucket type and eligible region I use, Firebase lists up to 5 GB-months of storage and 100 GB of downloads per month at no cost, subject to eligibility and transfer rules. Firestore has its own 1 GiB of stored data and 10 GiB per month of network egress allowance. Firebase pricing · Cloud Storage usage limits
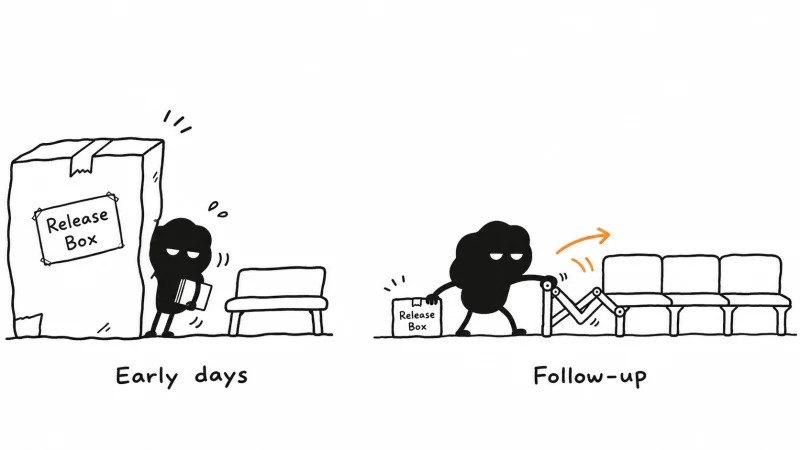
- I cleared out old deployment baggage. I removed obsolete build inputs and Hosting versions and kept recovery material locally. I wanted a small rollback window, with the last three releases as my target. During the cleanup, the live Hosting channel held the current release and I kept a local rollback copy. That let me separate what I needed to recover from what I needed to pay to store online.
- I changed how I built and ran the server. I first used Docker to build the server image, pushed it to Docker Hub, and deployed that image to Cloud Run. I then moved the production server behind a second-generation Firebase HTTP Function. Firebase builds and stores the image for that function and runs it on managed Cloud Run. For a Hosting-only update I can pin the function revision I already have, so changing the Hosting files doesn’t trigger another function build. How Google builds and deploys functions
The bill I came back to
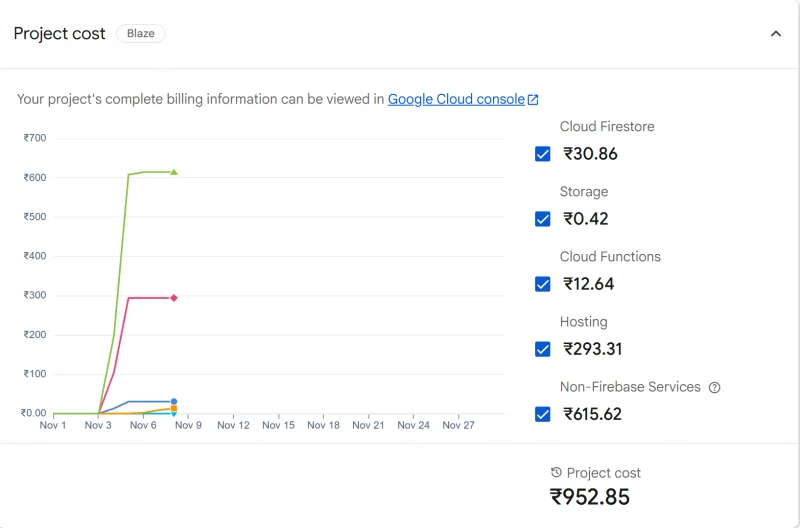
Those two lines were where I’d look first. The cost chart records charges that had already accumulated. I went to the usage panels to see what the site was doing after the changes.
What I kept and what I sent
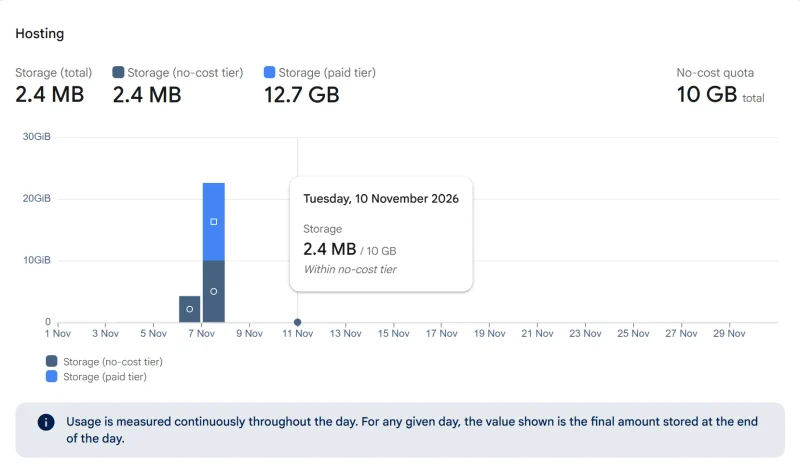
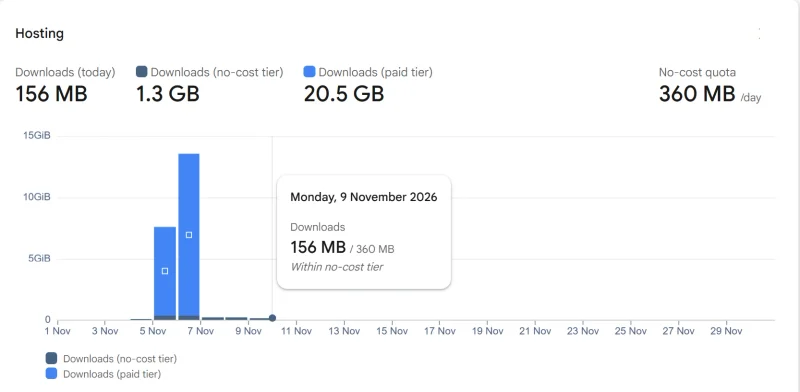
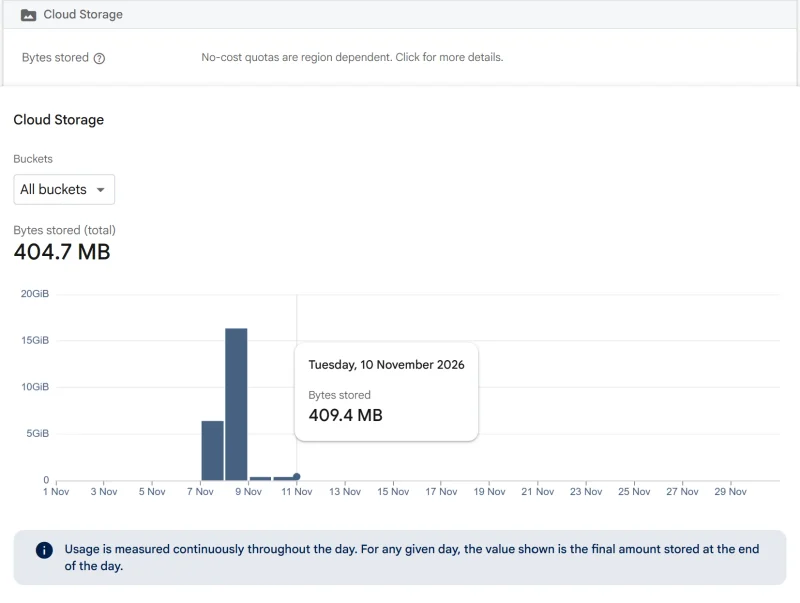
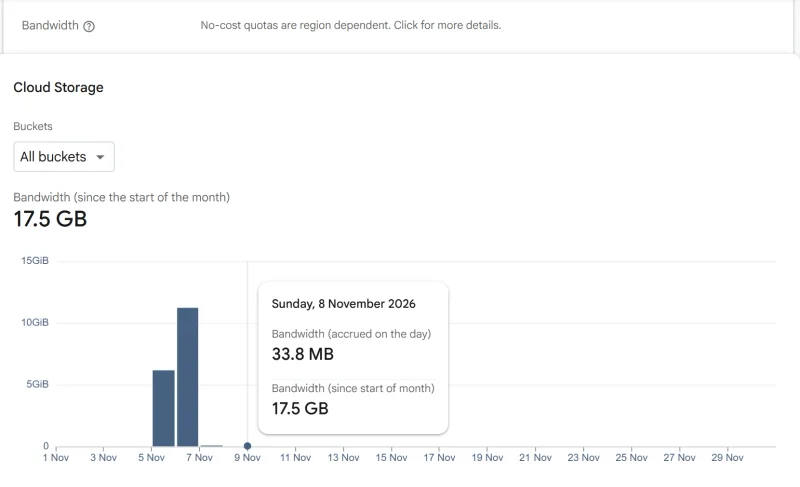
I’d moved some of the delivery work to Cloud Storage, so I opened that dashboard too. One panel tells me what I’m keeping. The other tells me what I’m sending.
A reader is one person. Firestore has other ideas.

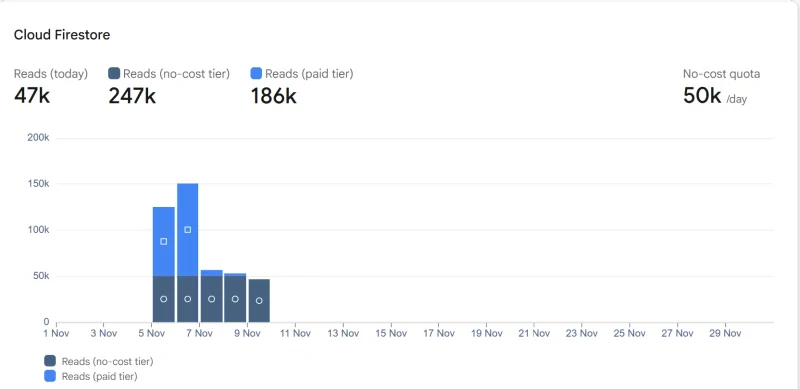
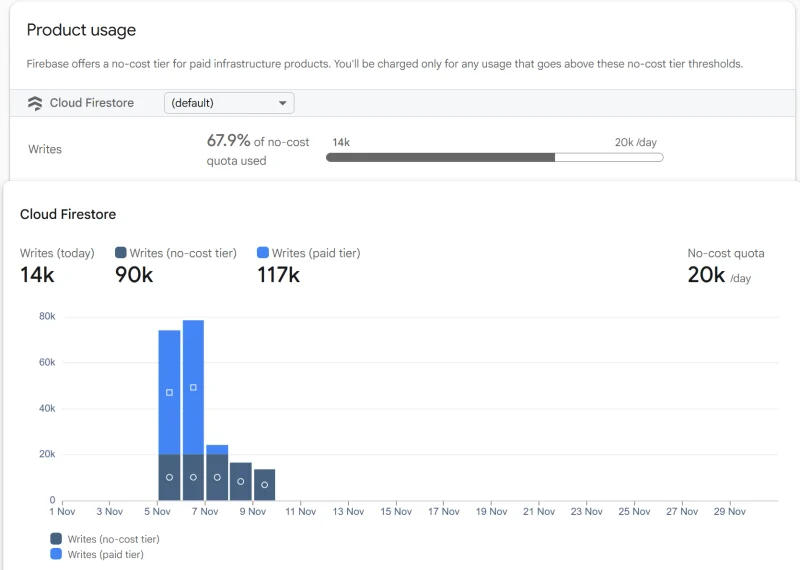
The bars were smaller even as the audience grew. That made me want to trace one ordinary visit and check how many reads it creates. I’d look at writes separately and check which ones come from scheduled work or publishing. Those jobs can run even when the reading room is empty.
Before and after
| What I was watching | Early reading | Follow-up reading |
|---|---|---|
| Active users | 5 | 25 |
| Hosting storage across the project | 22.7 GB in Part 1 | 2.4 MB on November 10 |
| Hosting downloads | Multiple GB on the early spike days | 156 MB for November 9 at capture |
| Firestore reads | Early daily bar peaked near 150,000 | 47,000 so far on the captured day |
| Firestore writes | Early daily bars reached roughly 75,000–80,000 | About 14,000 so far on the captured day |
This is what I saw when I went back to the dashboards. The Firestore comparisons put early daily bars next to readings that were still in progress. For a savings calculation, I’d pull complete periods and use the same scope on both sides.
Cost per active user
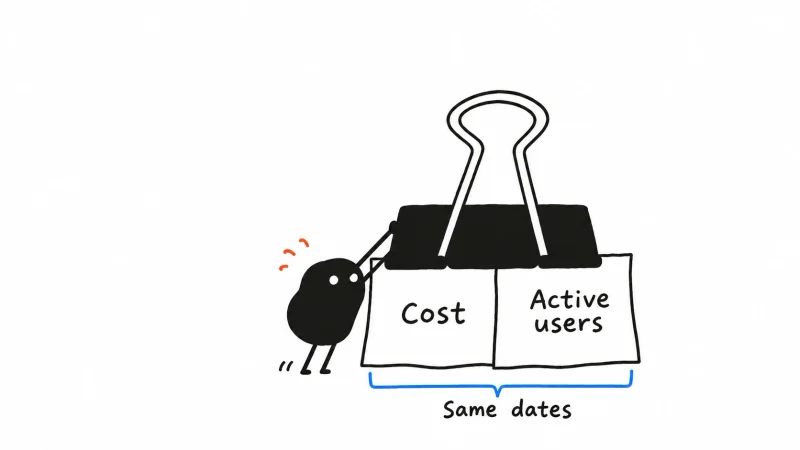
Estimated cloud cost per active user = cloud costs allocated to the app for the period ÷ distinct active users of the app in that same period
I’d start with a complete week or month, count each person once, and use the same definition of an active user in both windows. I’d keep one-off build or migration costs visible so I could explain a change in the average.
That’s the DevFinOps conversation I want to have. When someone asks how much it costs to serve the next twenty-five people, I want to be able to show my work.
Illustrations use the Ian Xiaohei Illustrations workflow.