

I started with a question about my environment, opened an investigation into my website, and set up a daily check to see what changed.
What if I could wake up, ask one question, and know what changed across my application overnight? What got slower in production? Did it also happen in pre-prod? Did anything get worse after the last deployment, and which service should I open first?
I already send telemetry from The Harithsa Notes to Dynatrace. I wanted a simpler way to sit down with that data and ask the kind of question I’d ask another engineer. Did the website get worse after I shipped something yesterday?
That’s where I’ve been using Bluebox by Dynatrace. It’s a separate product from the broader Dynatrace platform, with a workflow built around developers, SREs, and the coding agents they use. I can ask a question in chat, open an investigation when something looks wrong, or schedule the same question as a Routine. The answer depends on what the workspace can actually see. A single prompt can cover several environments when those signals are available and consistently tagged. Bluebox on Dynatrace Hub · Routines
I started by asking what needed attention
On November 10, I asked Bluebox to look across the environments my workspace could see and tell me what needed attention. I also asked it to state its assumptions. I wanted to know what the answer covered before I started reading the numbers.
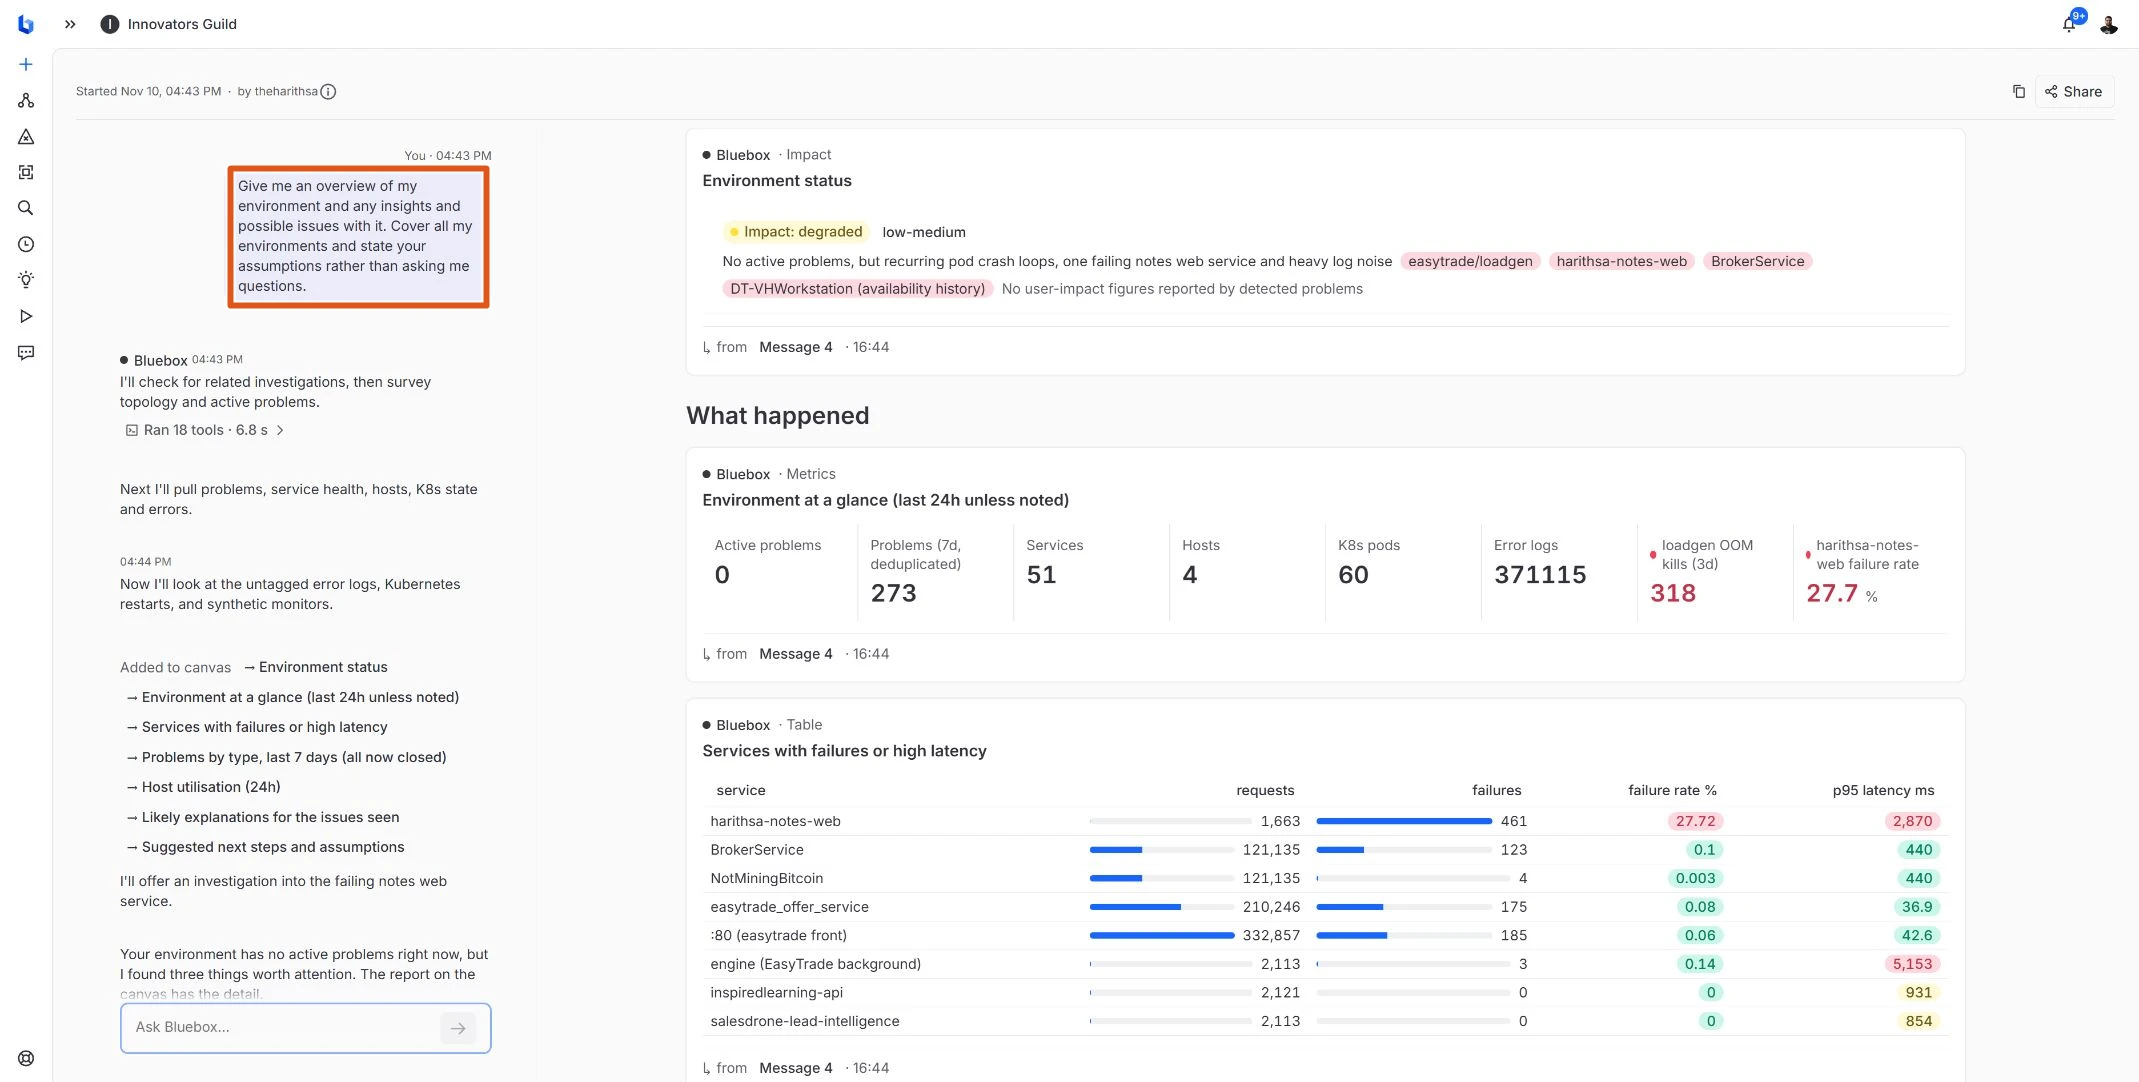
Bluebox checked topology, service metrics, and detected problems. It found zero active problems at the time, then called out something I could go and look at. The service metrics for The Harithsa Notes showed 461 failures in 1,663 requests over 24 hours, with p95 latency around 2.9 seconds. It offered to investigate why both numbers looked bad. I started that investigation from the chat.
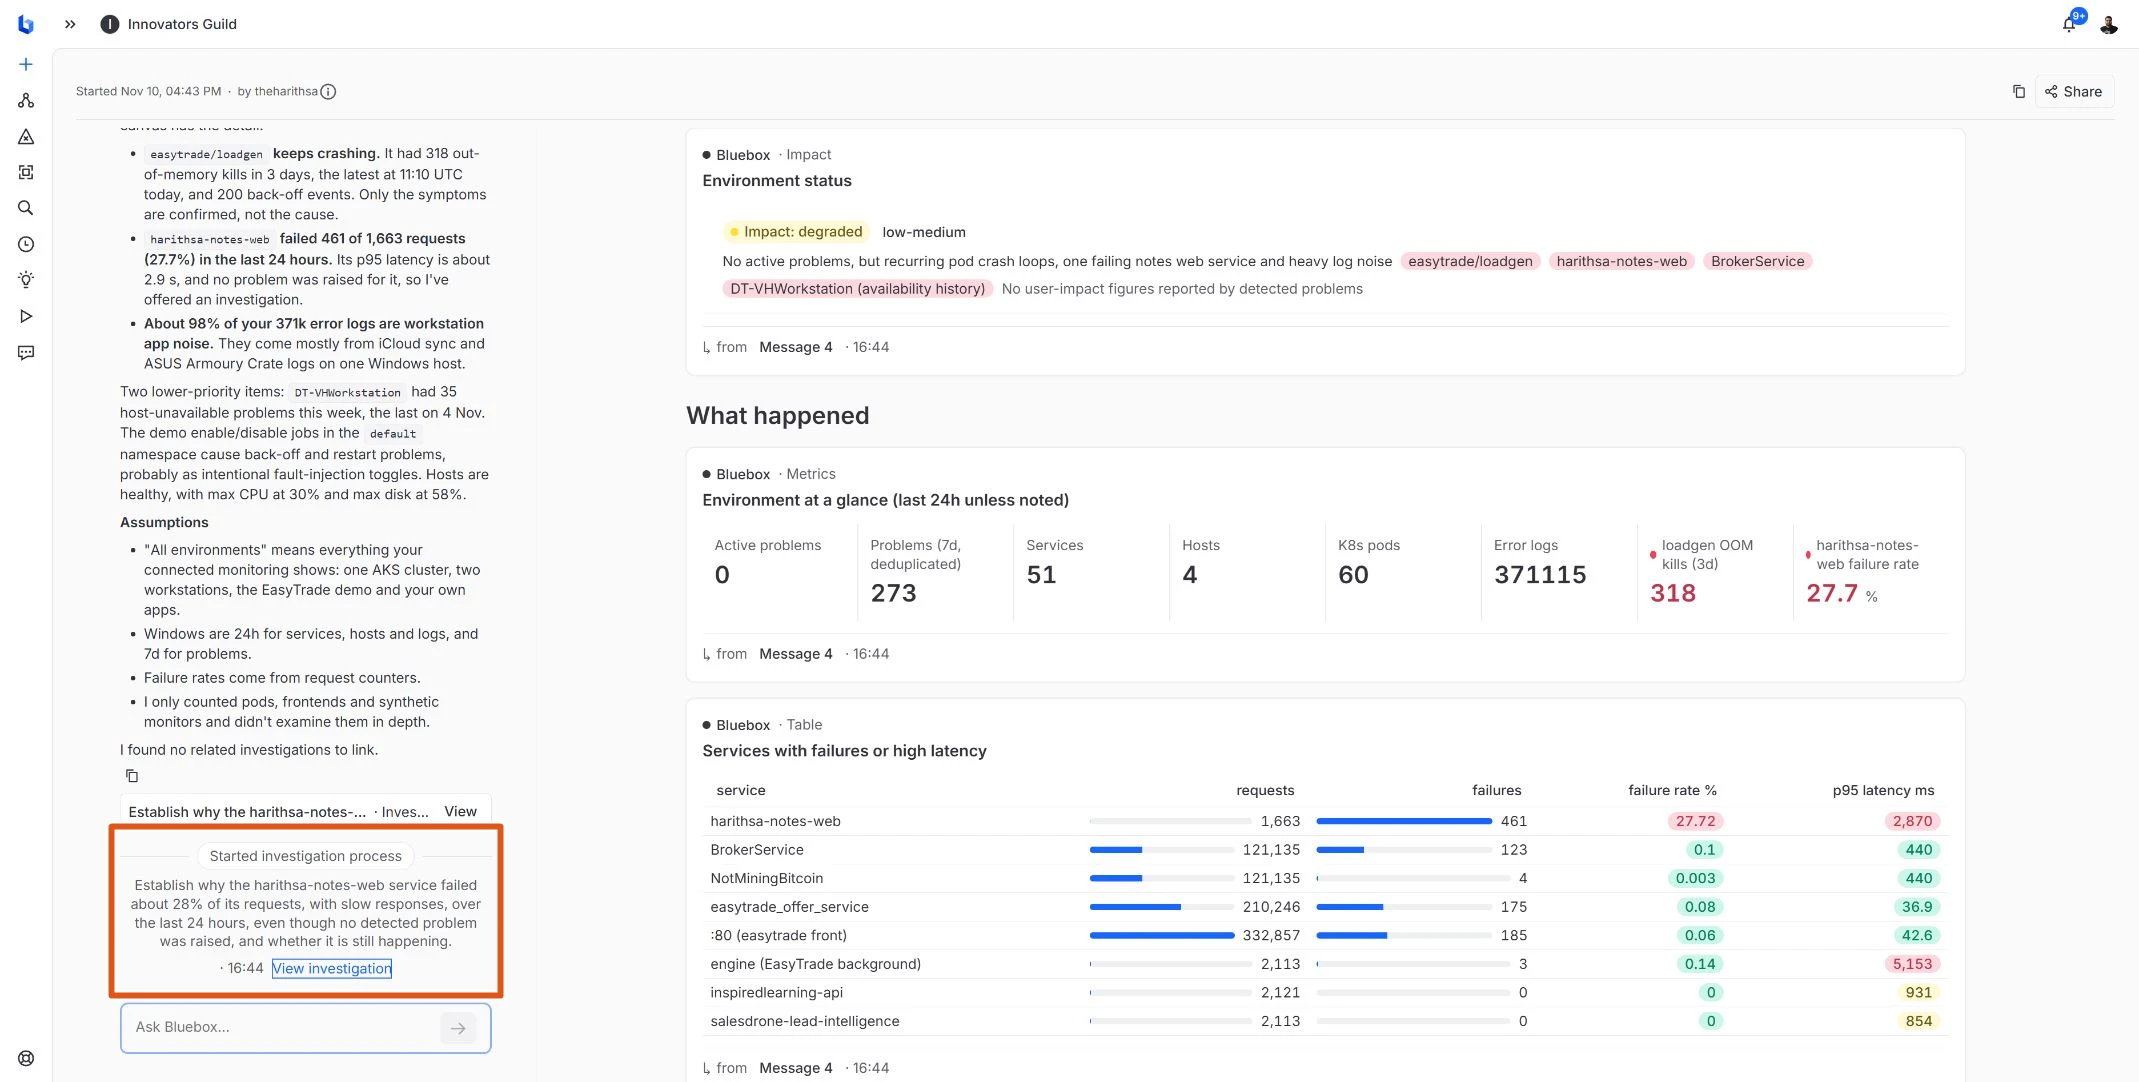
The investigation found two different things
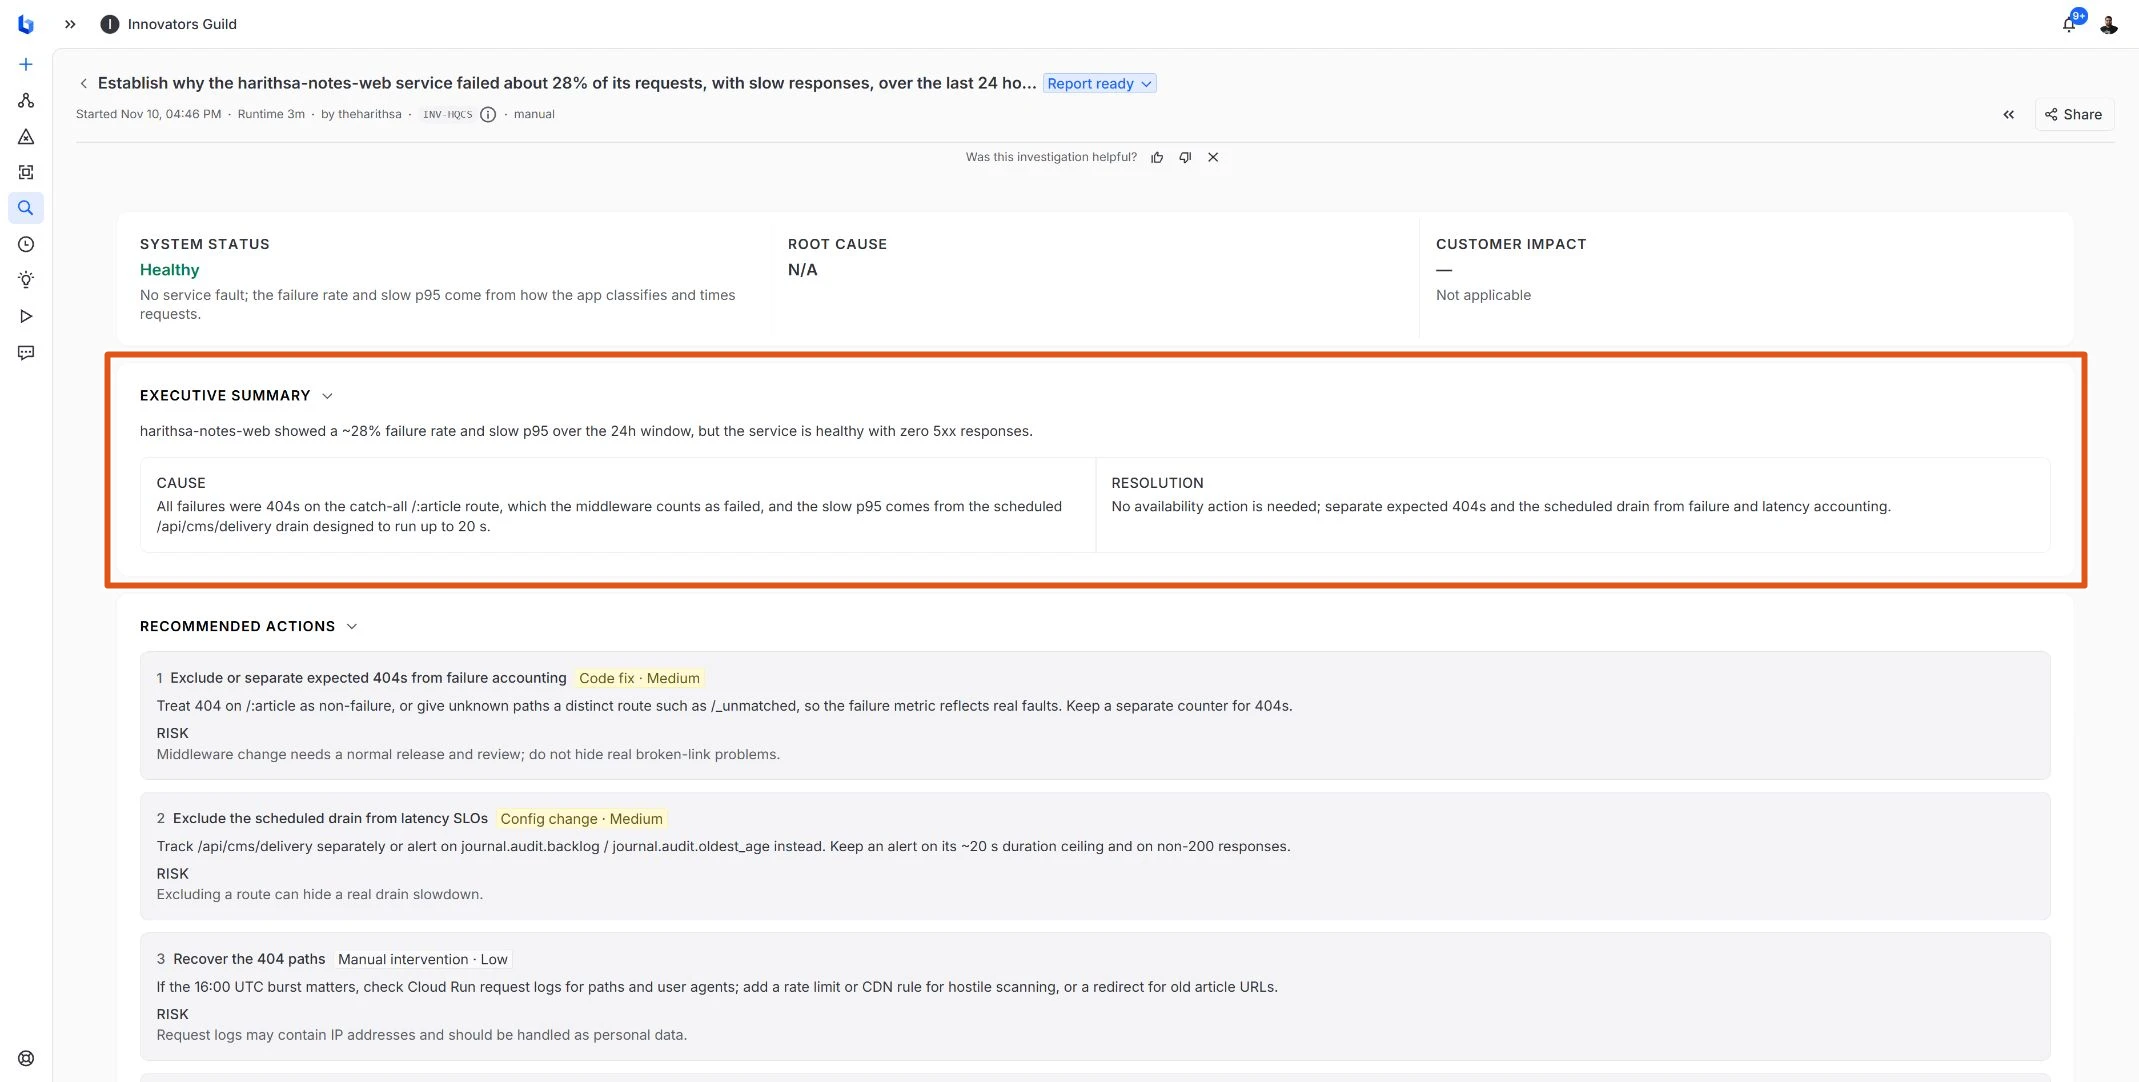
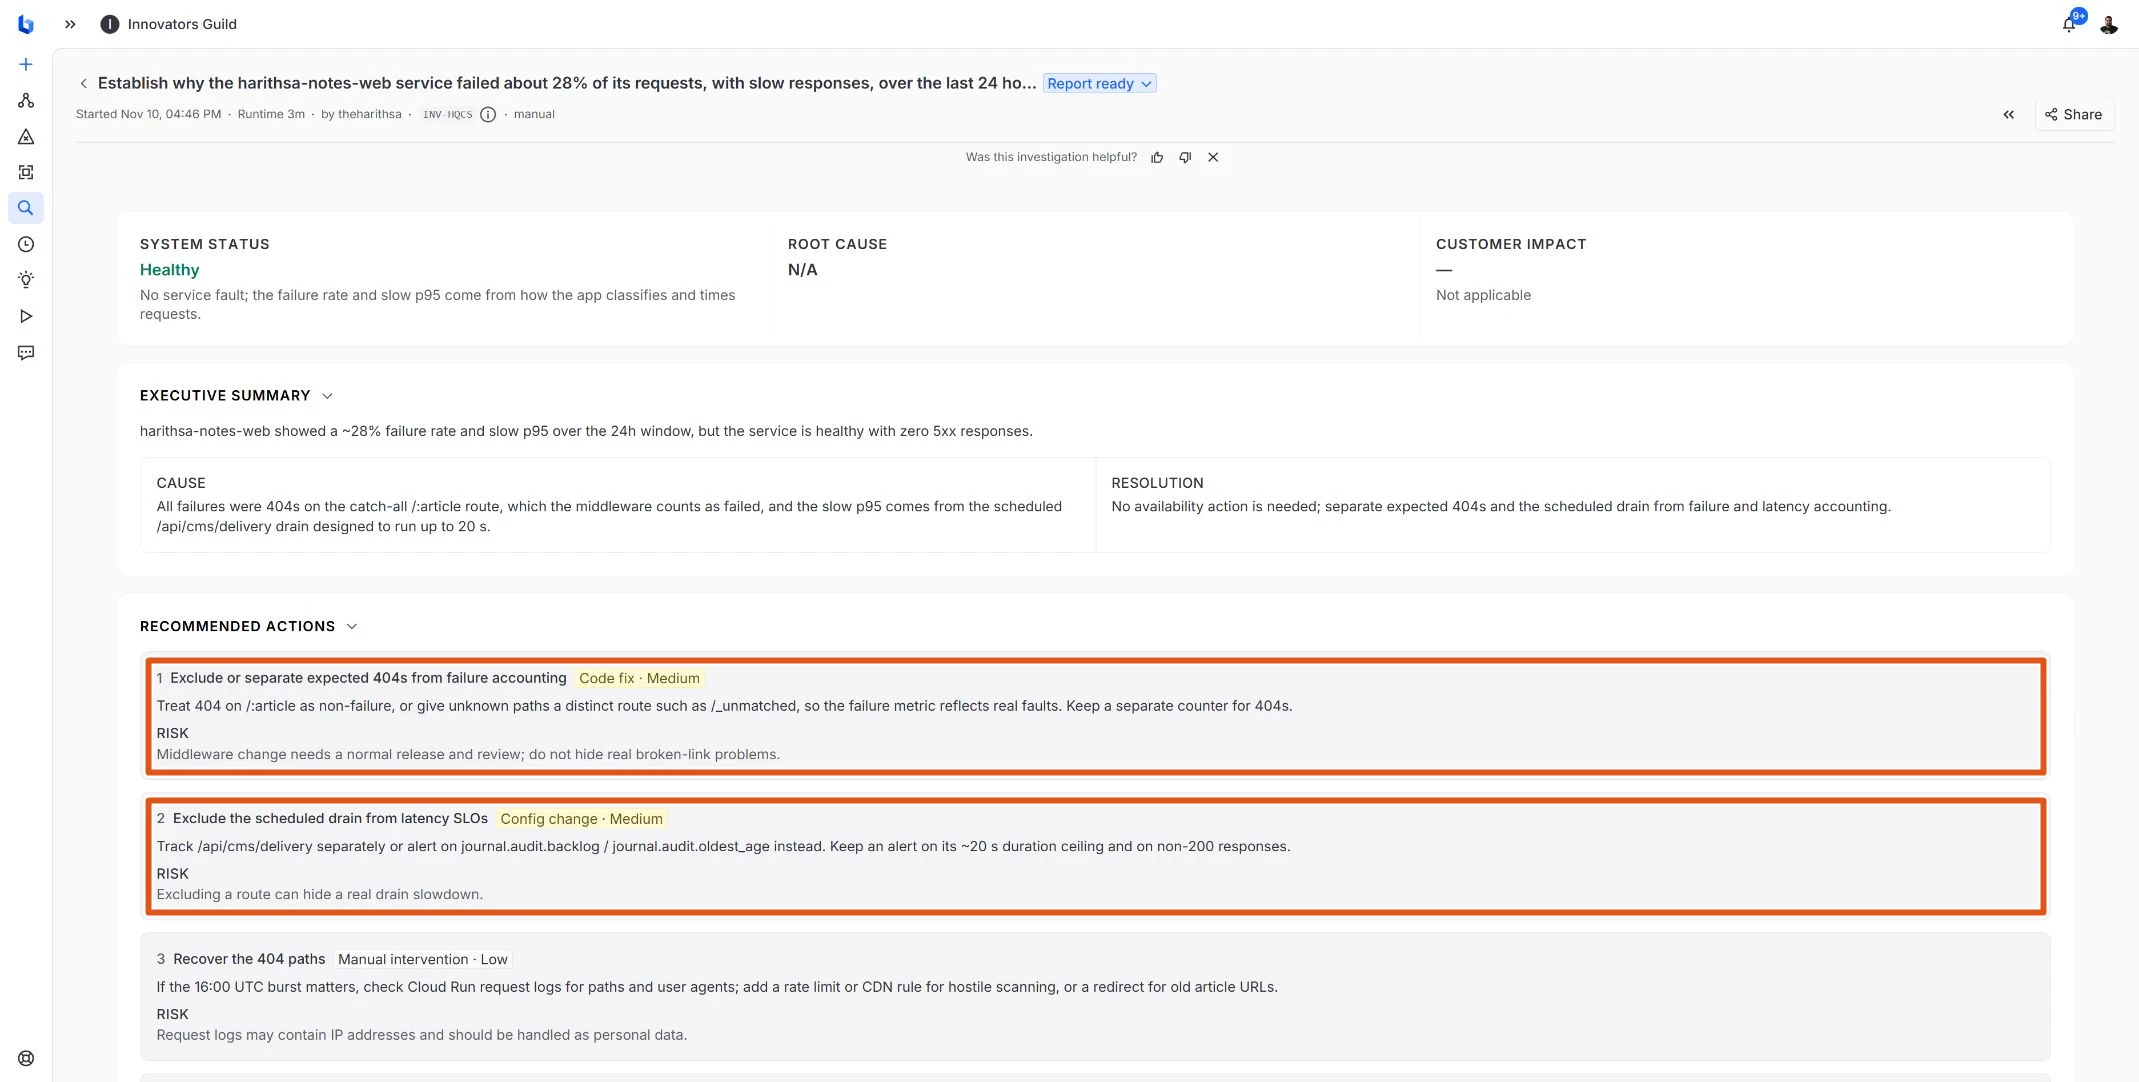
Bluebox checked server spans, logs, and the public repository. It found 336 failed requests in 1,231 root server spans in the investigation window. Every failure in that set was an HTTP 404 on the catch-all article route, and it found zero 5xx responses. Those counts came from traces. The earlier 461 of 1,663 came from service counters, so I read the two denominators separately.
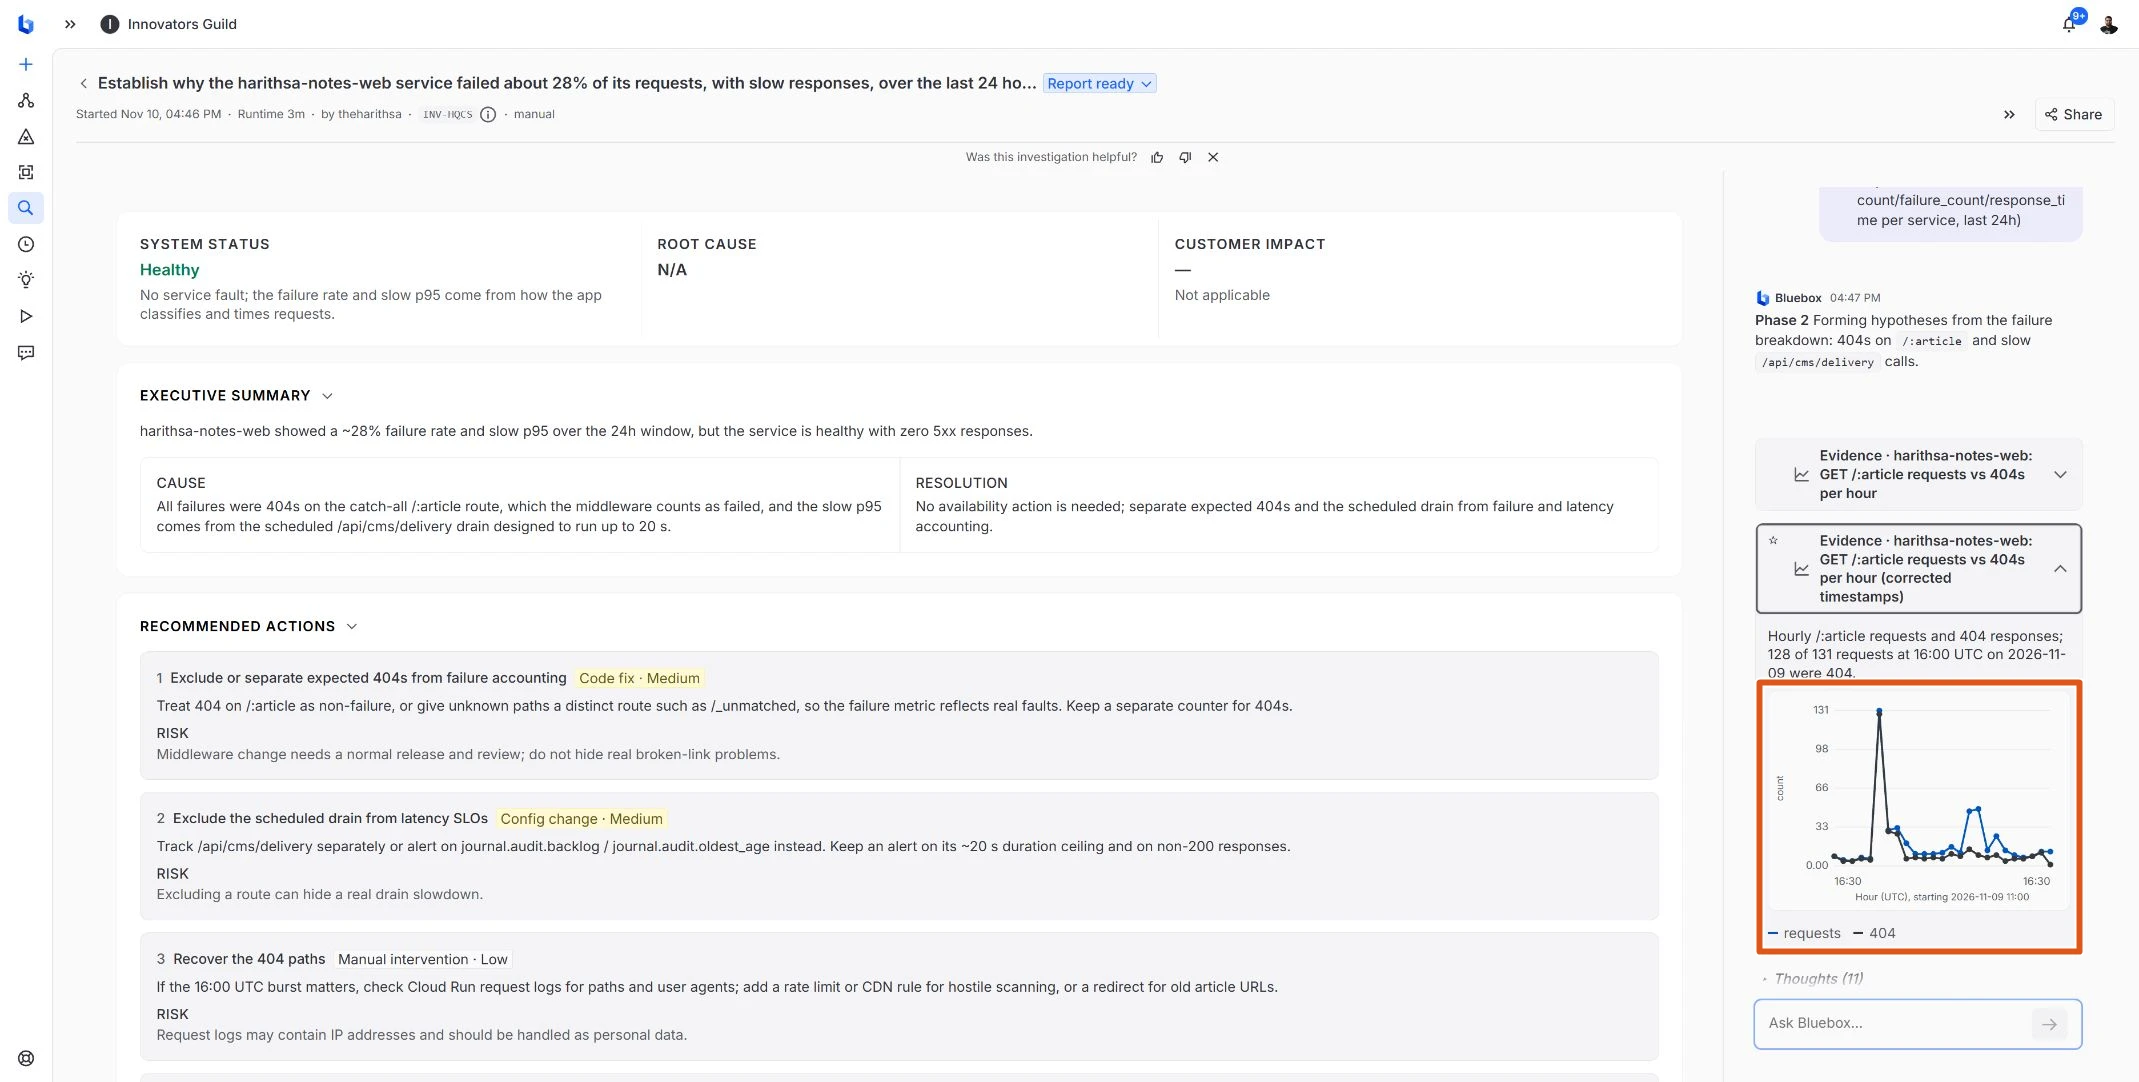
The repository showed how unknown root paths get labelled /:article and why a 404 counts as a failed request. One hour had 128 404s in 131 requests to that route. Bluebox could see the burst and the route pattern. The spans didn’t carry the actual requested paths, so it couldn’t tell me whether a crawler, a stale link, or something else was responsible.
The slow p95 had a different source. My scheduled delivery worker drains an audit queue, and those calls counted toward the same service latency percentile as reader requests. Bluebox measured about 8.9 seconds p95 for that worker and 0.58 seconds p95 for the other routes combined. It also saw the same application version serving spans throughout the window. That gave me a reason to look at how I measure the site before assuming a release had broken it.
I put the deployment check on a schedule
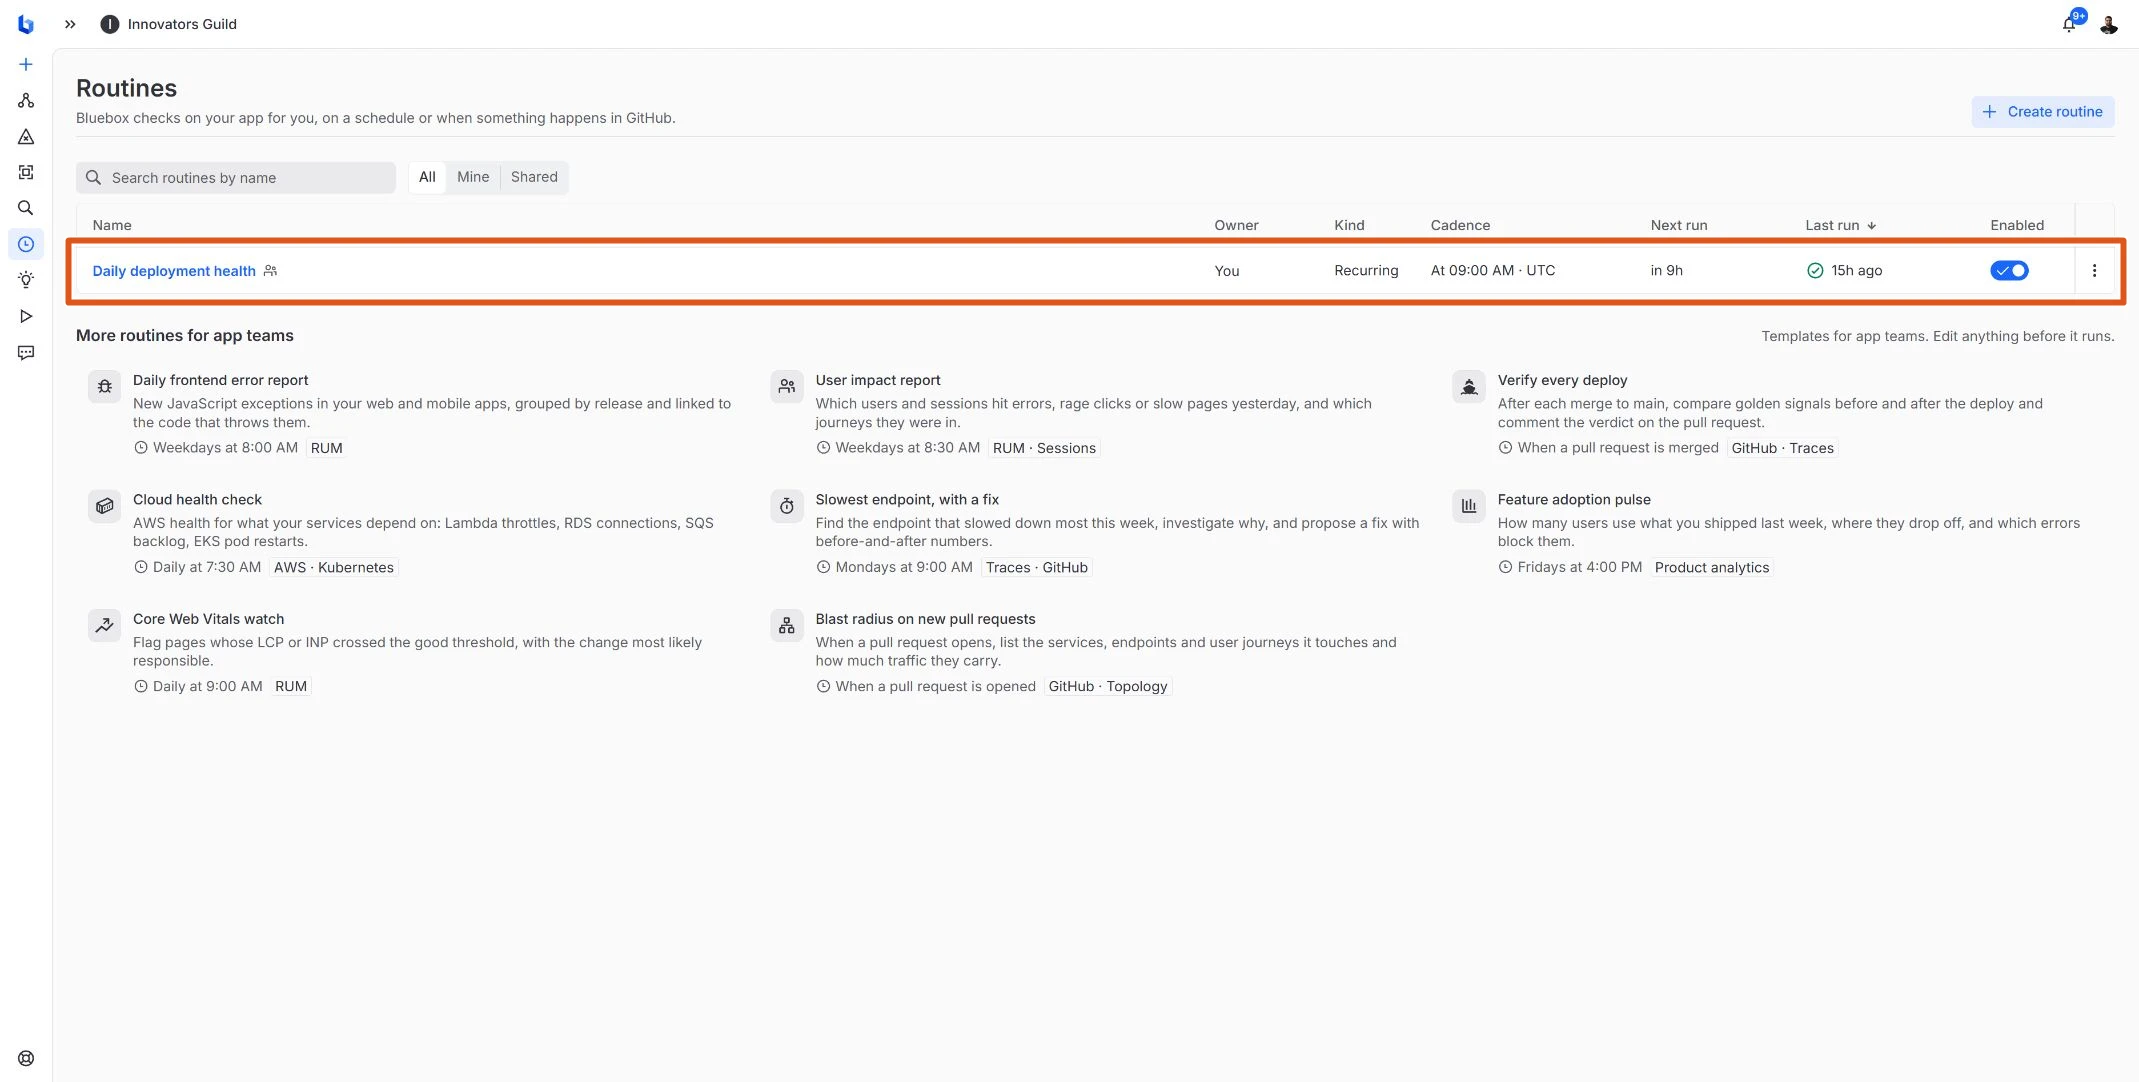
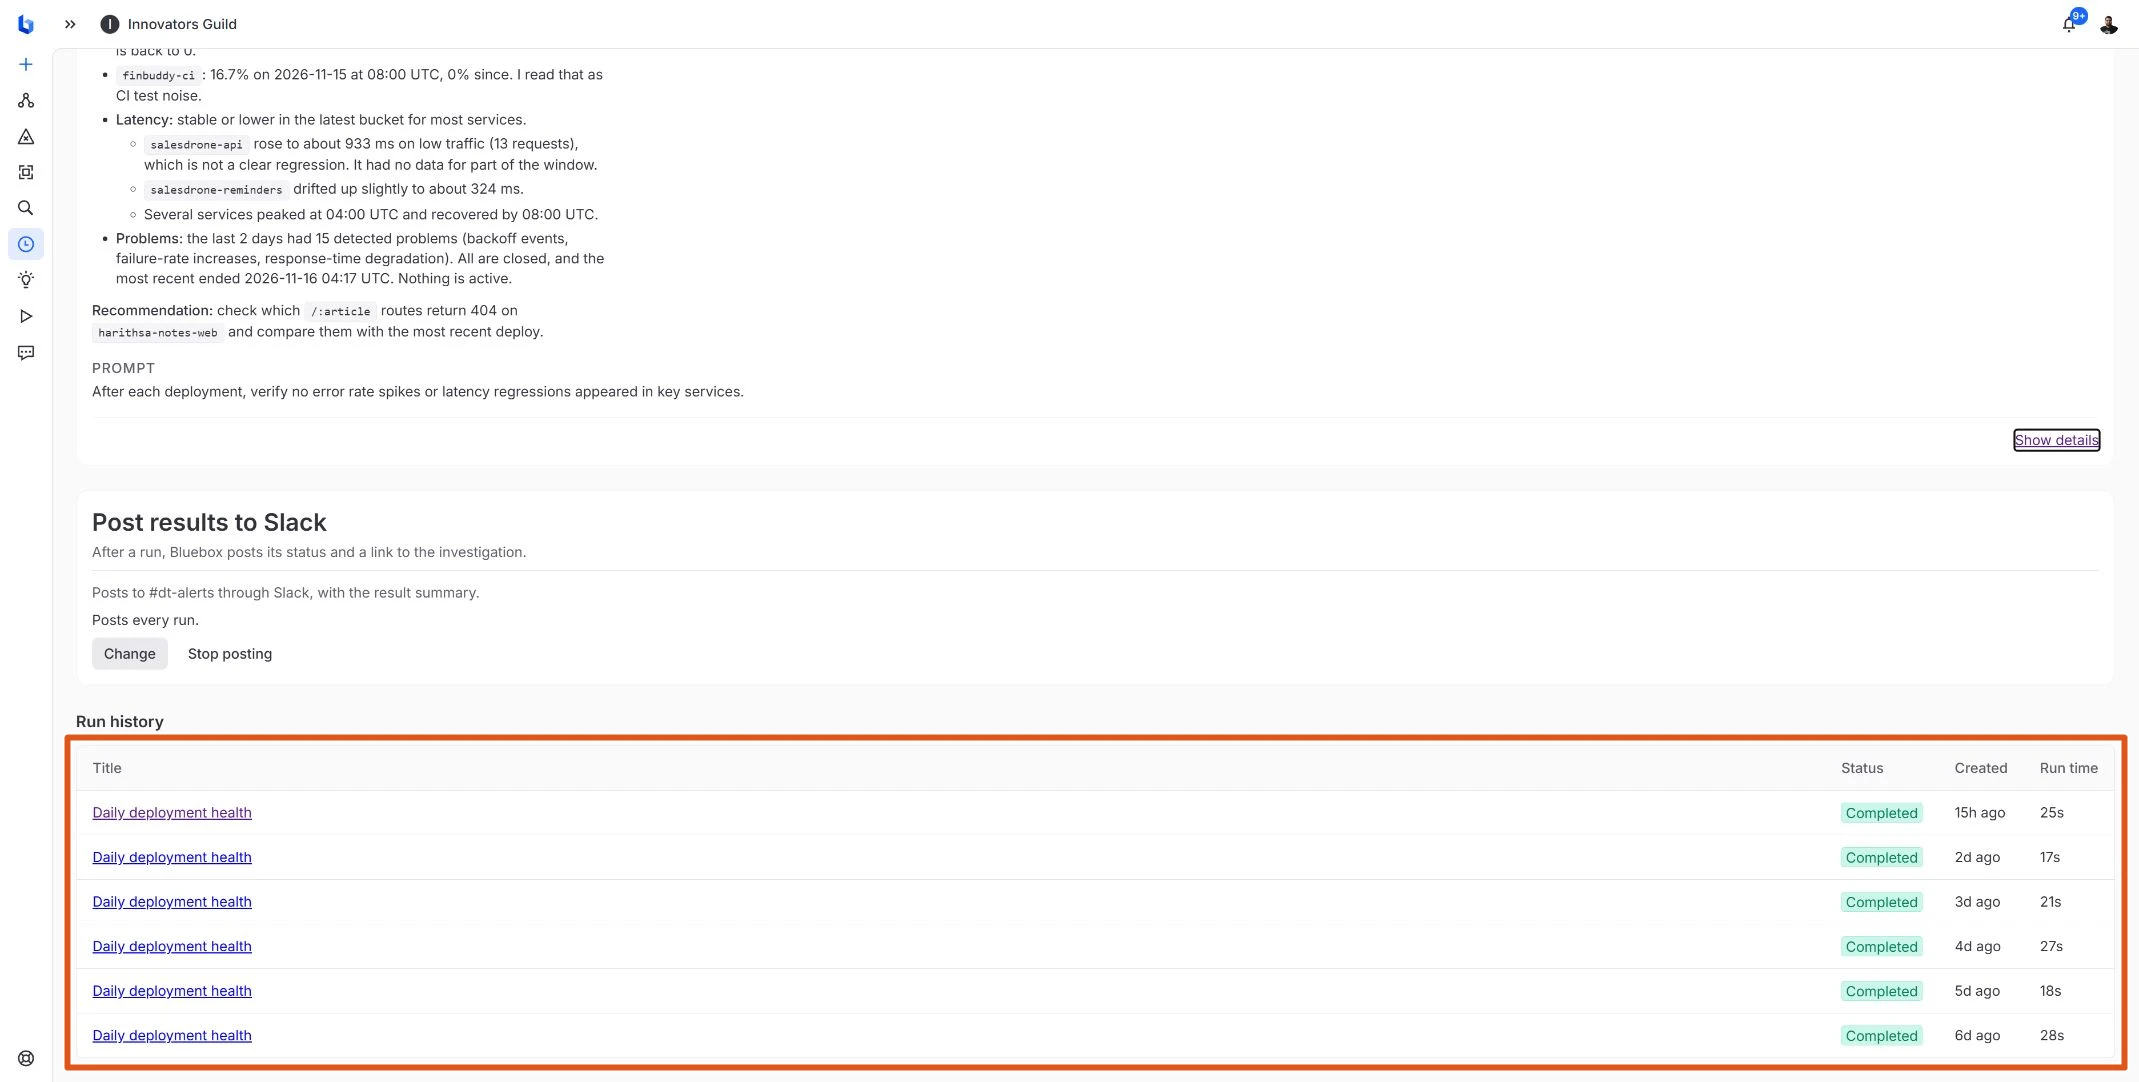
I set up Daily deployment health to run at 09:00 UTC, or 2:30 p.m. in India, and configured it to post the result to Slack. Its question was whether key services showed error-rate spikes or latency regressions after deployments.
| Report | What it picked up on The Harithsa Notes |
|---|---|
| November 11 | About 5.7% failures over 24 hours, at roughly 20–40 requests per hour. The report flagged it as a recurring issue to watch. |
| November 12 | About 2.2% across 24 hours, with zero errors in the latest hour. |
| November 13 | About 14.9% using a rough ratio of peak hourly counters. The report flagged the service for a closer look. |
| November 14 | About 1.55% over 24 hours. The latest hour had just 19 requests, so the report called out the small sample. |
| November 15 | 32 failures in 696 requests across the report window. Response time fell from about 1,259 ms to 943 ms between the compared buckets. |
| November 16 | 42 of 59 requests were counted as errors in one bucket. A separate span query found 54 failed spans, all article-route 404s. |
I read these as daily health reports. Some compare the latest hour to a 24-hour average, and others compare time buckets across the window. To measure the effect of a particular release, I’d want the rollout timestamp and revision in the same query.
The website got faster. It also returned more 404s.
The November 16 run is the one I’d show someone who asks what the routine gives me. It flagged the 08:00 UTC bucket for a jump in errors while average response time fell from about 1.6 seconds to 611 ms.
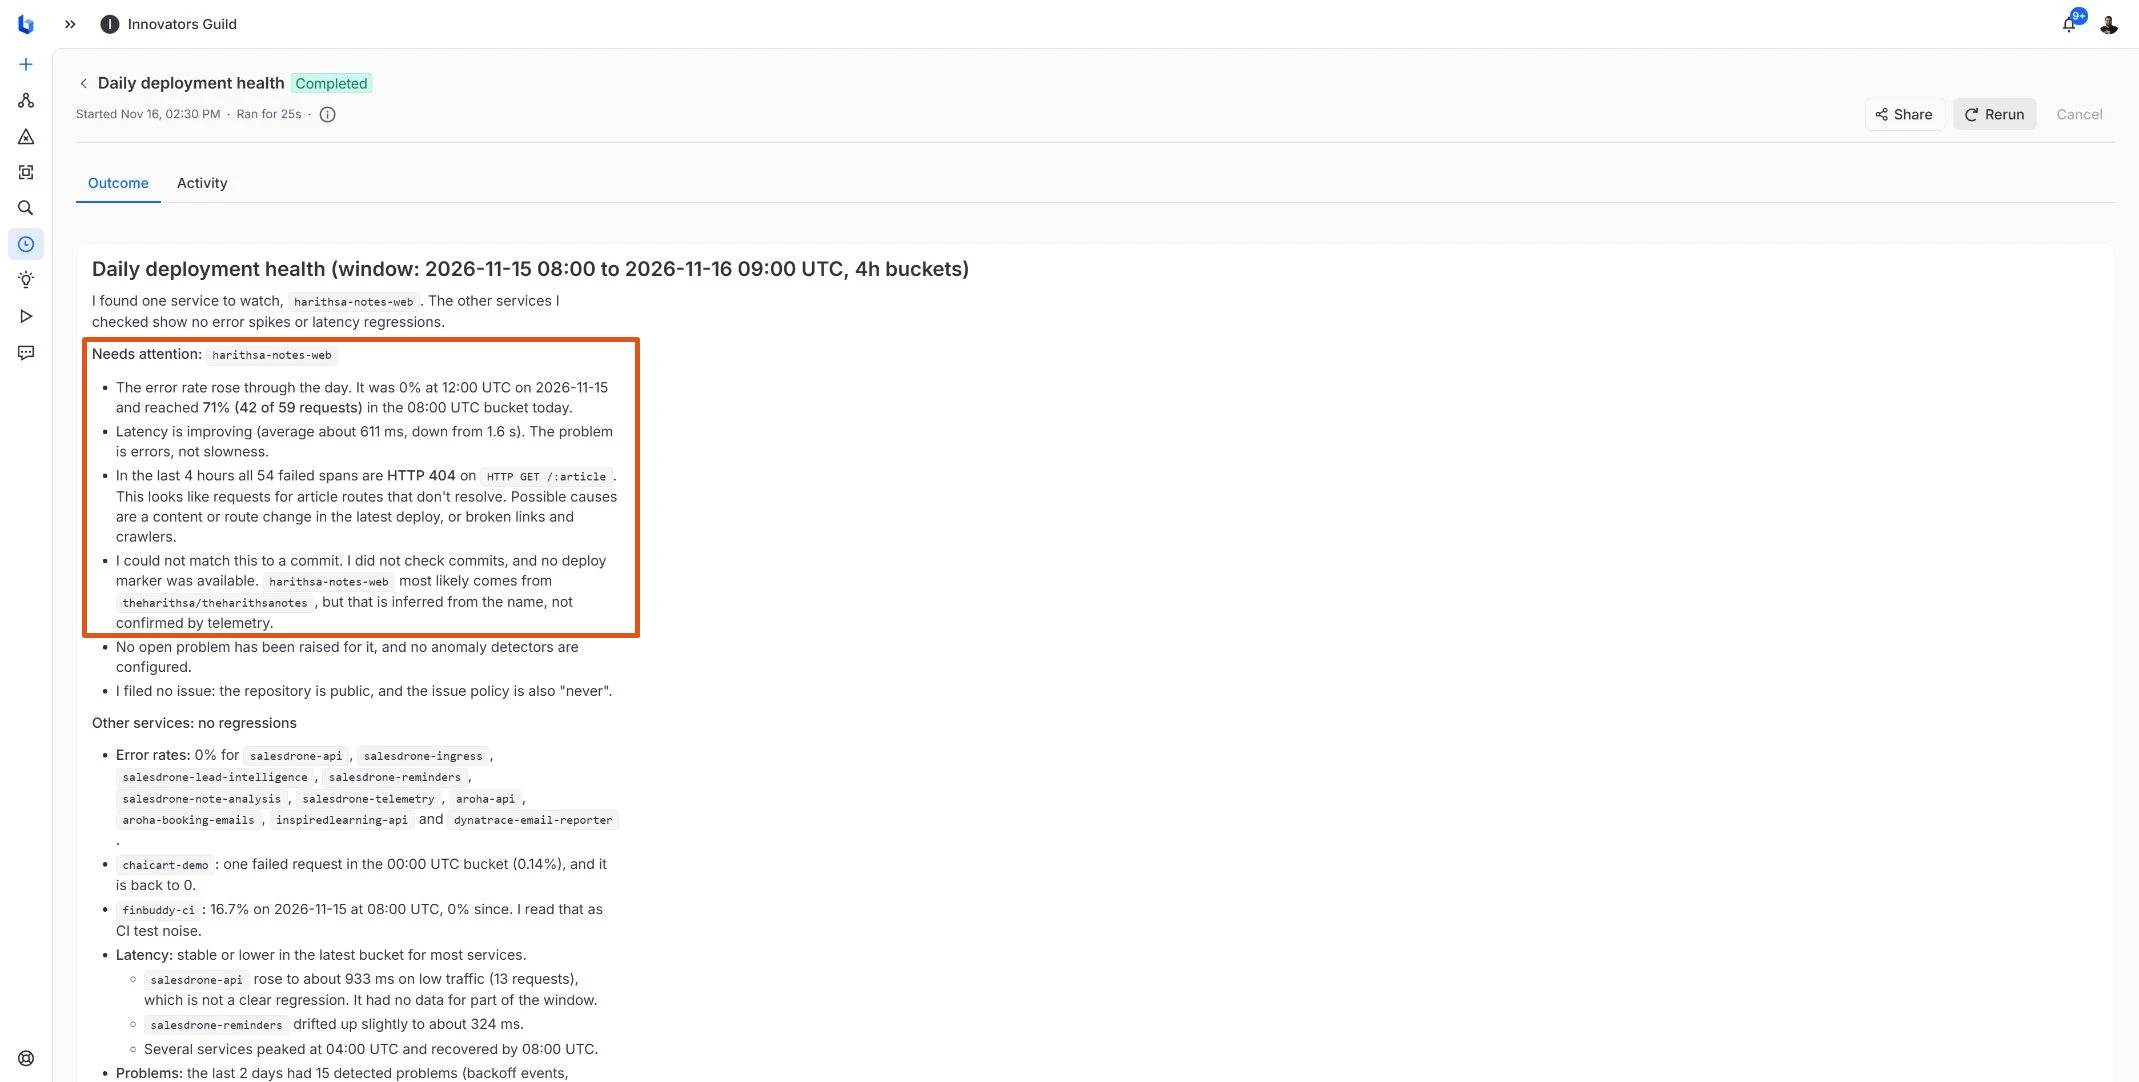
In Activity → View transcript, I can see how Bluebox arrived there. It queried service metrics and Dynatrace problem records first. Then it took failed spans for my web service over the previous four hours and grouped them by operation and HTTP status. There was one result row.
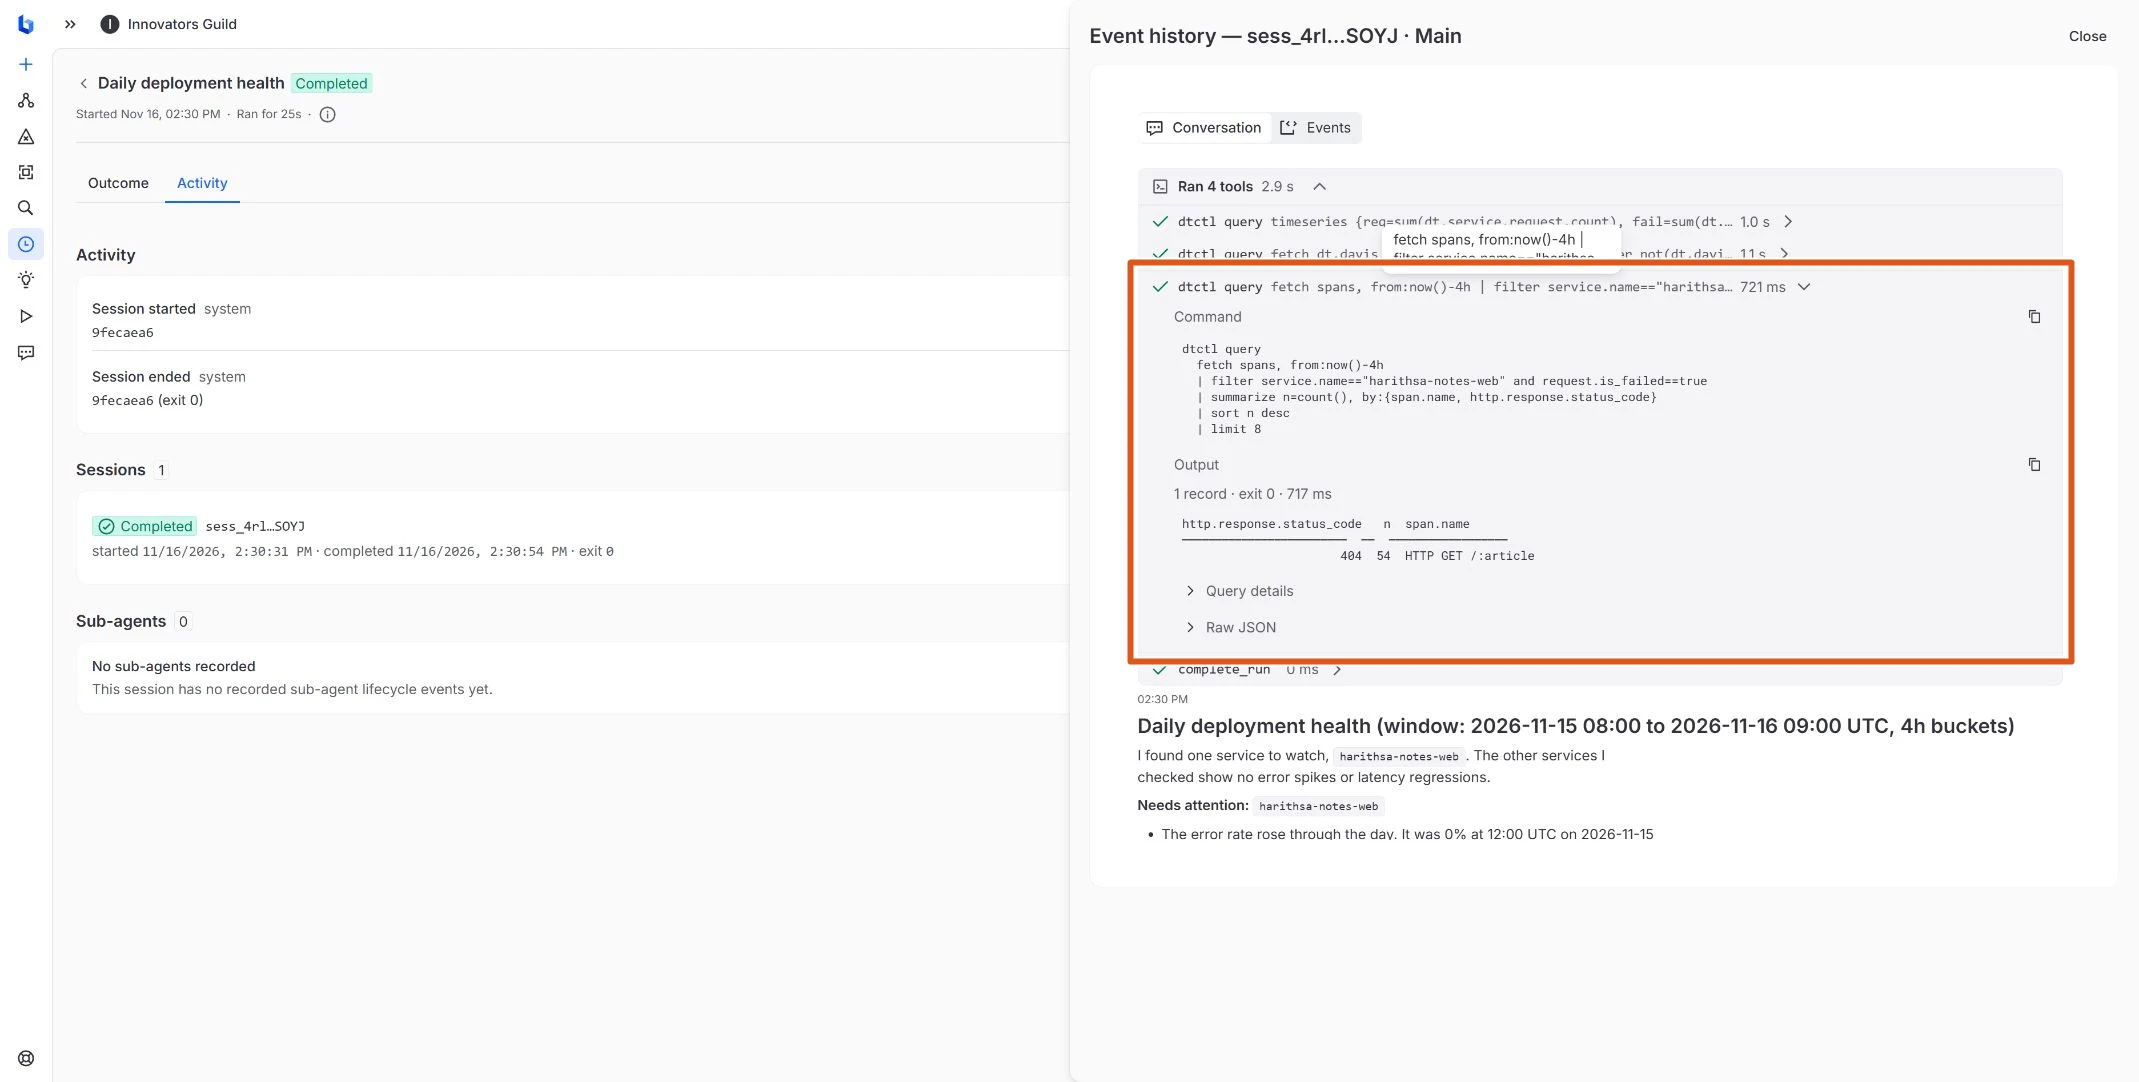
A fast 404 is still a 404. The November 16 routine didn’t have a deployment marker, and this run stopped before a commit comparison. The article route is where I’d look next. I’d check whether the missing paths are old links that need redirects, and whether any of them are valid articles that stopped resolving after a release.
What changes when Dynatrace detects a problem first
My website investigation started with a question. In the same workspace, 37 other investigations started from Dynatrace problem events. Most came from the demo environment. This is where I could see what Bluebox does with a detected slowdown, an increase in failures, or a Kubernetes back-off.
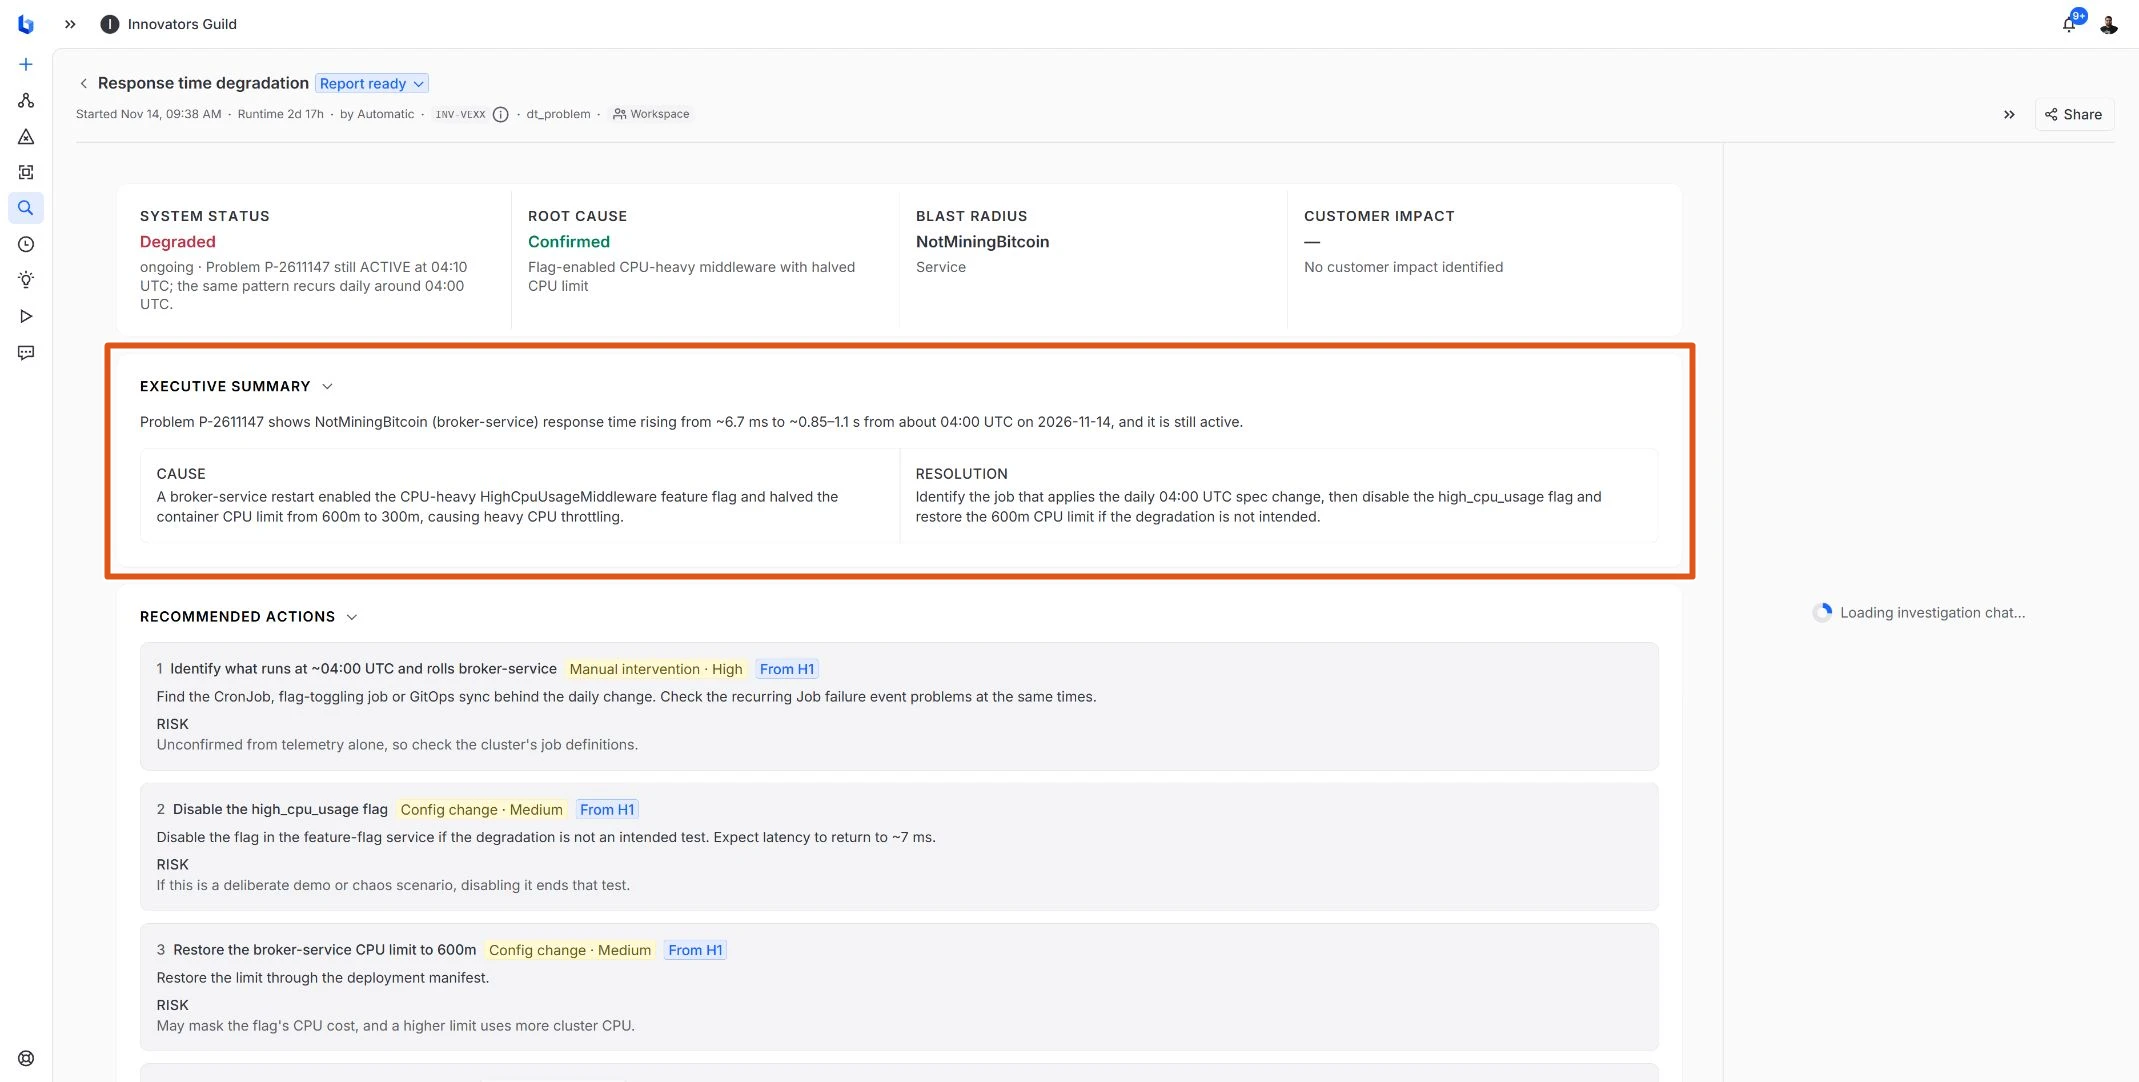
In the EasyTrade demo, the November 14 report followed a slowdown into the broker service. Its median response time rose from about 7 ms to roughly 0.9 seconds. The evidence pointed to CPU-heavy middleware enabled by a flag, a container CPU limit cut in half, and a rise in throttling. The investigation left me a concrete follow-up question. What was applying the same change around 04:00 UTC every day?
| Pattern in the investigation history | Reports | What the reports gave me to check |
|---|---|---|
| Website request failures and slow p95 · manual | 1 | Article 404s, reader-route latency, and the scheduled delivery worker. |
| EasyTrade broker slowdown | 6 | Middleware, container CPU limits, and throttling around the recurring slowdown. |
| EasyTrade dependency errors | 2 | A brief failure burst during dependency pod replacement. The replacement trigger remained open. |
| EasyTrade frontend proxy 502s | 4 | Short upstream connection failures around broker replacement. Readiness and rollout timing were worth inspecting. |
| EasyTrade load generator back-offs | 15 | Repeated out-of-memory restarts. Memory growth over time would help distinguish a leak from an undersized limit. |
| Scheduled demo job back-offs | 9 | DNS and namespace scope for jobs attempting to reach an internal service. |
| Monitoring agent image pull | 1 | A new node could not pull the configured agent image, leaving a monitoring gap on that node. |
The workspace history contained 38 completed reports between November 10 and 16. A completed report can still leave a recurring issue open for follow-up.
The question I’d put between pre-prod and production
Here’s the prompt I’d use next time I want to check a release. I’d give it the expected revision and rollout time, then ask it to show its work.
For this service and revision, compare the 30 minutes before and after the recorded rollout. Report pre-prod and production separately wherever that revision actually ran. Show request volume, error rate, p95 latency, and the main dependency failures. Link to the underlying evidence and flag any missing deployment marker, thin traffic, or gap in telemetry. Tell me what you’d check next.
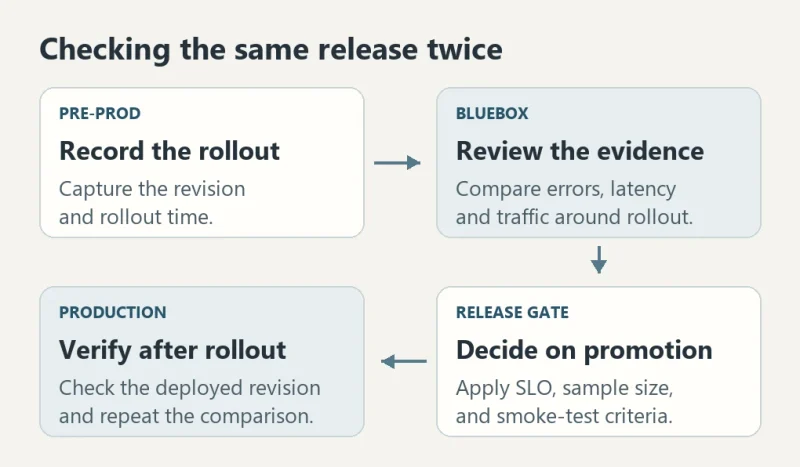
I’d keep the pass or fail criteria in the pipeline, with agreed SLO thresholds, a minimum sample size, and smoke tests for the journeys people actually use. Bluebox can help explain which dependency moved and which trace to open when a check fails. A daily routine is useful for spotting changes I missed. When I need evidence for one rollout, I start from the timestamp from the deployment platform. A merge to main might trigger a check, and I still need to establish when that revision began serving traffic. Bluebox CLI reference · Dynatrace Site Reliability Guardian
What needs to be connected
- Start with the observability backend. Sign in to Bluebox, open your workspace, and check Settings → Setup. Bluebox can prepare a backend connection during onboarding. If you’re bringing an existing Dynatrace environment, check the workspace’s backend connection and make sure it can query the environment where your application telemetry lands. The credentials to read telemetry and to ingest it serve different purposes. Get started · Backend connection troubleshooting
- Verify the deployed service. Instrument with OpenTelemetry where needed and use the endpoint for that setup. If you already send telemetry to a connected backend, first check whether Bluebox can read it before changing exporters. Open Environment, find the service, and ask for a recent request count and example trace in the intended environment.
- Connect GitHub if you want code context. Choose the repositories Bluebox needs. That gives investigations a way to look at code changes and, where configured, hand findings back as GitHub issues. A telemetry-only health check can start without it. GitHub setup
- Choose where you want to ask. Use Bluebox in the browser or connect a supported coding agent such as Codex, Claude Code, Cursor, or Kiro to Bluebox’s MCP server. In the other direction, Connections documents integrations for AWS DevOps Agent, Azure SRE Agent, Kiro, and GitHub Copilot. The AWS and Azure integrations can give an investigation cloud context; the Bluebox MCP server lets an external client ask Bluebox questions. If your coding agent already uses custom MCP tools, Bluebox can sit alongside them in that client. Connections · Connect a coding agent
- Save a routine once the question works. Start with Daily deployment health. Set the scope, time window, and schedule. Check the first run for data gaps. My routine is set to post a summary to Slack. Bluebox also supports GitHub-event triggers where the workspace has that option and a GitHub connection. Routines
Telemetry I’d put in place before relying on the answer
On my site, browser monitoring covers what readers experience, server telemetry covers requests that reach the application, and deployment records cover what shipped. A static file served by Hosting or a cache hit can bypass my server entirely. That matters when I compare what people saw with what the backend recorded.
- Give the service, environment, and release consistent names. Set
service.name,service.version, anddeployment.environment.name. Carry the real commit or artifact revision in deployment records so you can join them to runtime evidence. OpenTelemetry service attributes · Environment attributes - Measure what changed and trace where it changed. Capture request rate, errors, and duration with normalised route names. Trace real database, queue, and API calls, and correlate structured logs with actual trace IDs. Follow work across the queue when the user request triggers a background job.
- Capture the user journey and its outcome. Browser monitoring can tell me a button failed or a page never loaded. For a payment, booking, or claim, I also need a server-side event recorded after the business transaction commits. Keep personal data and raw payloads out of routine telemetry, and keep request IDs out of metric dimensions.
- Verify a real success and a safe failure. Search for the traces, logs, metrics, and outcome events at their destination. Check the environment and revision on what came through. An accepted export is only one step in proving that the person on call can find that record. Dynatrace data ingestion
Where I think this gets interesting
| Industry | The question I’d start with |
|---|---|
| Banking | After the payments rollout, did customers reach confirmation, and did the core system actually post the transfers? Where did the pending ones stop? |
| Services | Did slower booking confirmations start in the web app or with a downstream scheduling provider? Did the retry queue clear? |
| Insurance | When a claim document uploads successfully but the claim stays pending, did validation fail, did extraction time out, or is the backlog growing? |
| Manufacturing | After an edge gateway update, did the machines stop reporting, or did readings get stuck between the gateway, broker, and ingestion service? |
Now put an AI component in any of those journeys. A claims assistant can still answer in two seconds while getting worse at reading a new document format. I’d trace the model call, retrieval and tool calls, and watch latency, failures, and token use. I’d also evaluate a representative sample against a quality baseline and track those scores over time. That’s how I’d start telling a slow model from a decline in answer quality. The evaluations and their data handling need the same care as the application telemetry. Dynatrace AI Observability
My first question for Bluebox was what needed attention. The next time I deploy, I have a more specific one. What did the reader get, and can I trace it back to what I shipped? If the answer stops halfway, I know where to look for the missing evidence.
References
Bluebox
- Bluebox product overview
- Getting started with Bluebox
- Troubleshoot the observability backend connection
- Schedule health checks with Bluebox Routines
- Bluebox connections and integrations
- Connect a coding agent to Bluebox through MCP
- Bluebox CLI reference